Demographic data help tell part of our story.
The Institute, Center, and Office (ICO) workforce profiles below describe the demographic composition of each ICO’s workforce. Data that reflect processes and policies can be utilized to investigate potential disparities which may present barriers to equity in employment opportunities. For accessibility and visualization purposes, graphics may not be to scale.
Institutes, Centers, and Offices:
CC CIT CSR FIC NCATS NCCIH NCI NEI NHGRI NHLBI NIA NIAAA NIAID NIAMS NIBIB NICHD NIDA NIDCD NIDCR NIDDK NIEHS NIGMS NIMH NIMHD NINDS NINR NLM OD ORF ORSOD/ORF/ORS
Click graphic below to open full-size graphic in a new window.
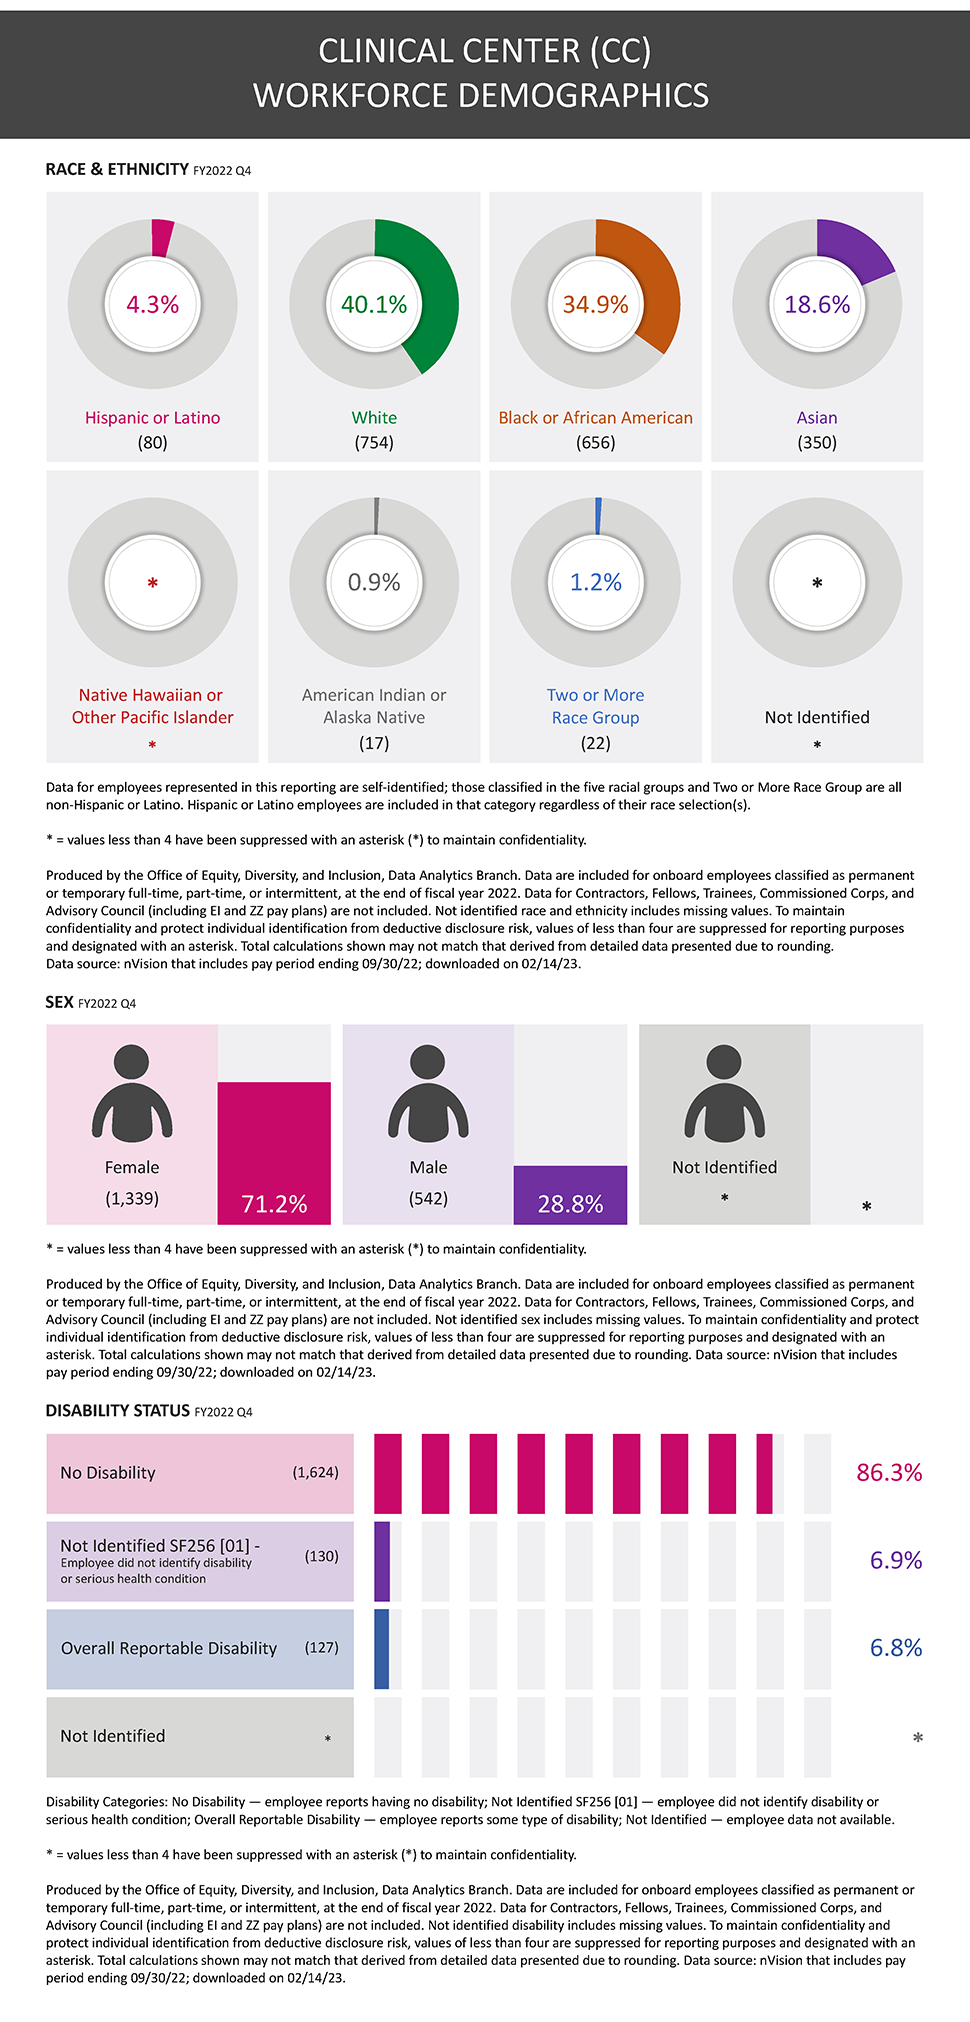
National Institutes of Health Clinical Center Workforce Demographics
RACE & ETHNICITY: Workforce Demographics by Race and Ethnicity. Graphic showing the proportions of Hispanic or Latino, White, Black or African American, Asian, Native Hawaiian or Other Pacific Islander, American Indian or Alaska Native, Two or More Race Group, and Not Identified NIH employees for Fiscal Year 2022 Fourth Quarter.
RACE & ETHNICITY: Hispanic or Latino = 80, 4.3%; White = 754, 40.1%; Black or African American = 656, 34.9%; Asian = 350, 18.6%; Native Hawaiian or Other Pacific Islander = *, *%; American Indian or Alaska Native = 17, 0.9%; Two or More Race Group = 22, 1.2%; Not Identified = *, *%
RACE & ETHNICITY: Data for employees represented in this reporting are self-identified; those classified in the five racial groups and Two or More Race Group are all non-Hispanic or Latino. Hispanic or Latino employees are included in that category regardless of their race selection(s).
SEX: Workforce Demographics by Sex. Graphic showing the proportions of Female and Male NIH employees for Fiscal Year 2022 Fourth Quarter.
SEX: FEMALE = 1339, 71.2%; MALE = 542, 28.8%; Not Identified = *, *%
DISABILITY: Workforce Demographics by Disability Status. Graphic showing the proportions of NIH employees having disability status as the following: No Disability, Not Identified SF256 [01] – Employee did not identify disability or serious health condition, Overall Reportable Disability, and Not Identified NIH employees for Fiscal Year 2022 Fourth Quarter.
DISABILITY: No Disability = 1624, 86.3%; Not Identified SF256 [01] – Employee did not identify disability or serious health condition = 130, 6.9%; Overall Reportable Disability = 127, 6.8%; Not Identified = *, *%
DISABILITY: Disability Categories: No Disability – employee reports having no disability; Not Identified SF256 [01] – employee did not identify disability or serious health condition; Overall Reportable Disability – employee reports some type of disability; Not Identified – employee data not available.
Produced by the Office of Equity, Diversity, and Inclusion, Data Analytics Branch. Data are included for onboard employees classified as permanent or temporary full-time, part-time, or intermittent, at the end of fiscal year 2022. Data for Contractors, Fellows, Trainees, Commissioned Corps, and Advisory Council (including EI and ZZ pay plans) are not included. Not identified race and ethnicity, sex, and disability include missing values. To maintain confidentiality and protect individual identification from deductive disclosure risk, values of less than four are suppressed for reporting purposes and designated with an asterisk. Total calculations shown may not match that derived from detailed data presented due to rounding. Data source: nVision that includes pay period ending 09/30/22; downloaded on 02/14/23.
Click graphic below to open full-size graphic in a new window.
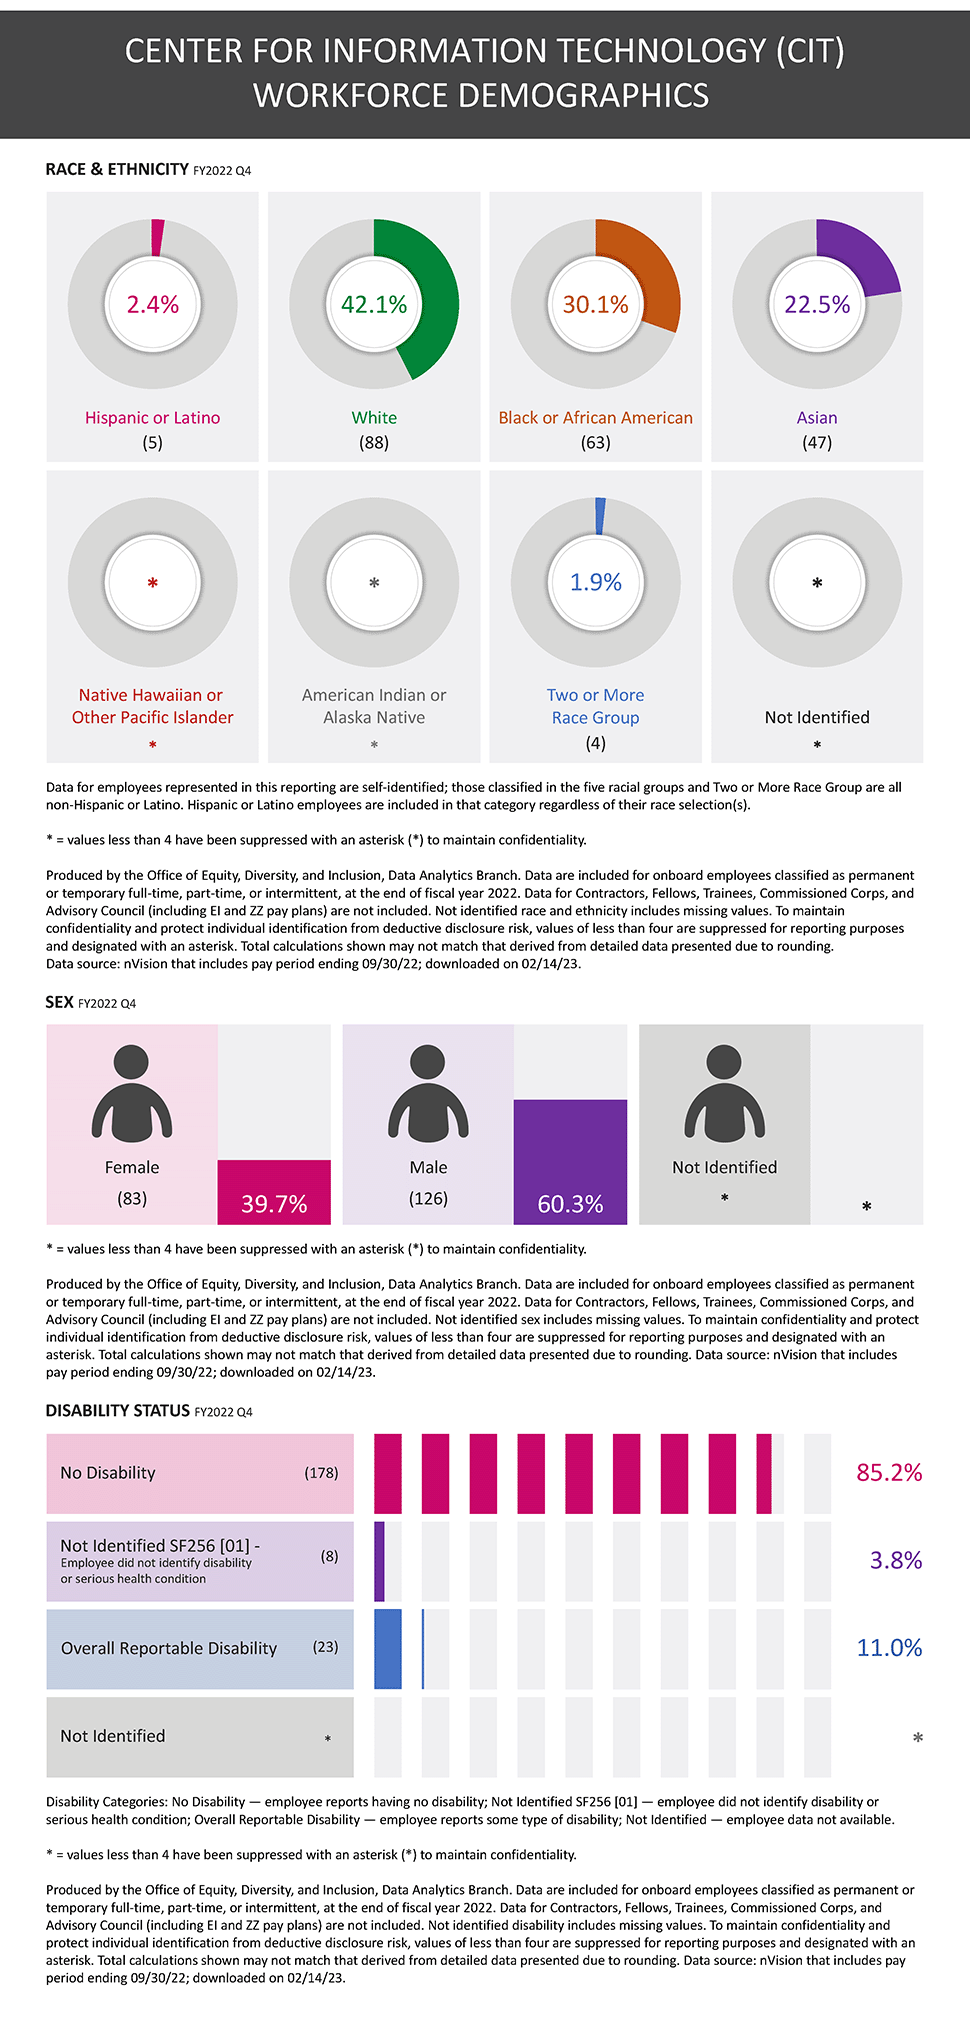
National Institutes of Health Center for Information Technology Workforce Demographics
RACE & ETHNICITY: Workforce Demographics by Race and Ethnicity. Graphic showing the proportions of Hispanic or Latino, White, Black or African American, Asian, Native Hawaiian or Other Pacific Islander, American Indian or Alaska Native, Two or More Race Group, and Not Identified NIH employees for Fiscal Year 2022 Fourth Quarter.
RACE & ETHNICITY: Hispanic or Latino = 5, 2.4%; White = 88, 42.1%; Black or African American = 63, 30.1%; Asian = 47, 22.5%; Native Hawaiian or Other Pacific Islander = *, *%; American Indian or Alaska Native = *, *%; Two or More Race Group = 4, 1.9%; Not Identified = *, *%
RACE & ETHNICITY: Data for employees represented in this reporting are self-identified; those classified in the five racial groups and Two or More Race Group are all non-Hispanic or Latino. Hispanic or Latino employees are included in that category regardless of their race selection(s).
SEX: Workforce Demographics by Sex. Graphic showing the proportions of Female and Male NIH employees for Fiscal Year 2022 Fourth Quarter.
SEX: FEMALE = 83, 39.7%; MALE = 126, 60.3%; Not Identified = *, *%
DISABILITY: Workforce Demographics by Disability Status. Graphic showing the proportions of NIH employees having disability status as the following: No Disability, Not Identified SF256 [01] – Employee did not identify disability or serious health condition, Overall Reportable Disability, and Not Identified NIH employees for Fiscal Year 2022 Fourth Quarter.
DISABILITY: No Disability = 178, 85.2%; Not Identified SF256 [01] – Employee did not identify disability or serious health condition = 8, 3.8%; Overall Reportable Disability = 23, 11.0%; Not Identified = *, *%
DISABILITY: Disability Categories: No Disability – employee reports having no disability; Not Identified SF256 [01] – employee did not identify disability or serious health condition; Overall Reportable Disability – employee reports some type of disability; Not Identified – employee data not available.
Produced by the Office of Equity, Diversity, and Inclusion, Data Analytics Branch. Data are included for onboard employees classified as permanent or temporary full-time, part-time, or intermittent, at the end of fiscal year 2022. Data for Contractors, Fellows, Trainees, Commissioned Corps, and Advisory Council (including EI and ZZ pay plans) are not included. Not identified race and ethnicity, sex, and disability include missing values. To maintain confidentiality and protect individual identification from deductive disclosure risk, values of less than four are suppressed for reporting purposes and designated with an asterisk. Total calculations shown may not match that derived from detailed data presented due to rounding. Data source: nVision that includes pay period ending 09/30/22; downloaded on 02/14/23.
Click graphic below to open full-size graphic in a new window.
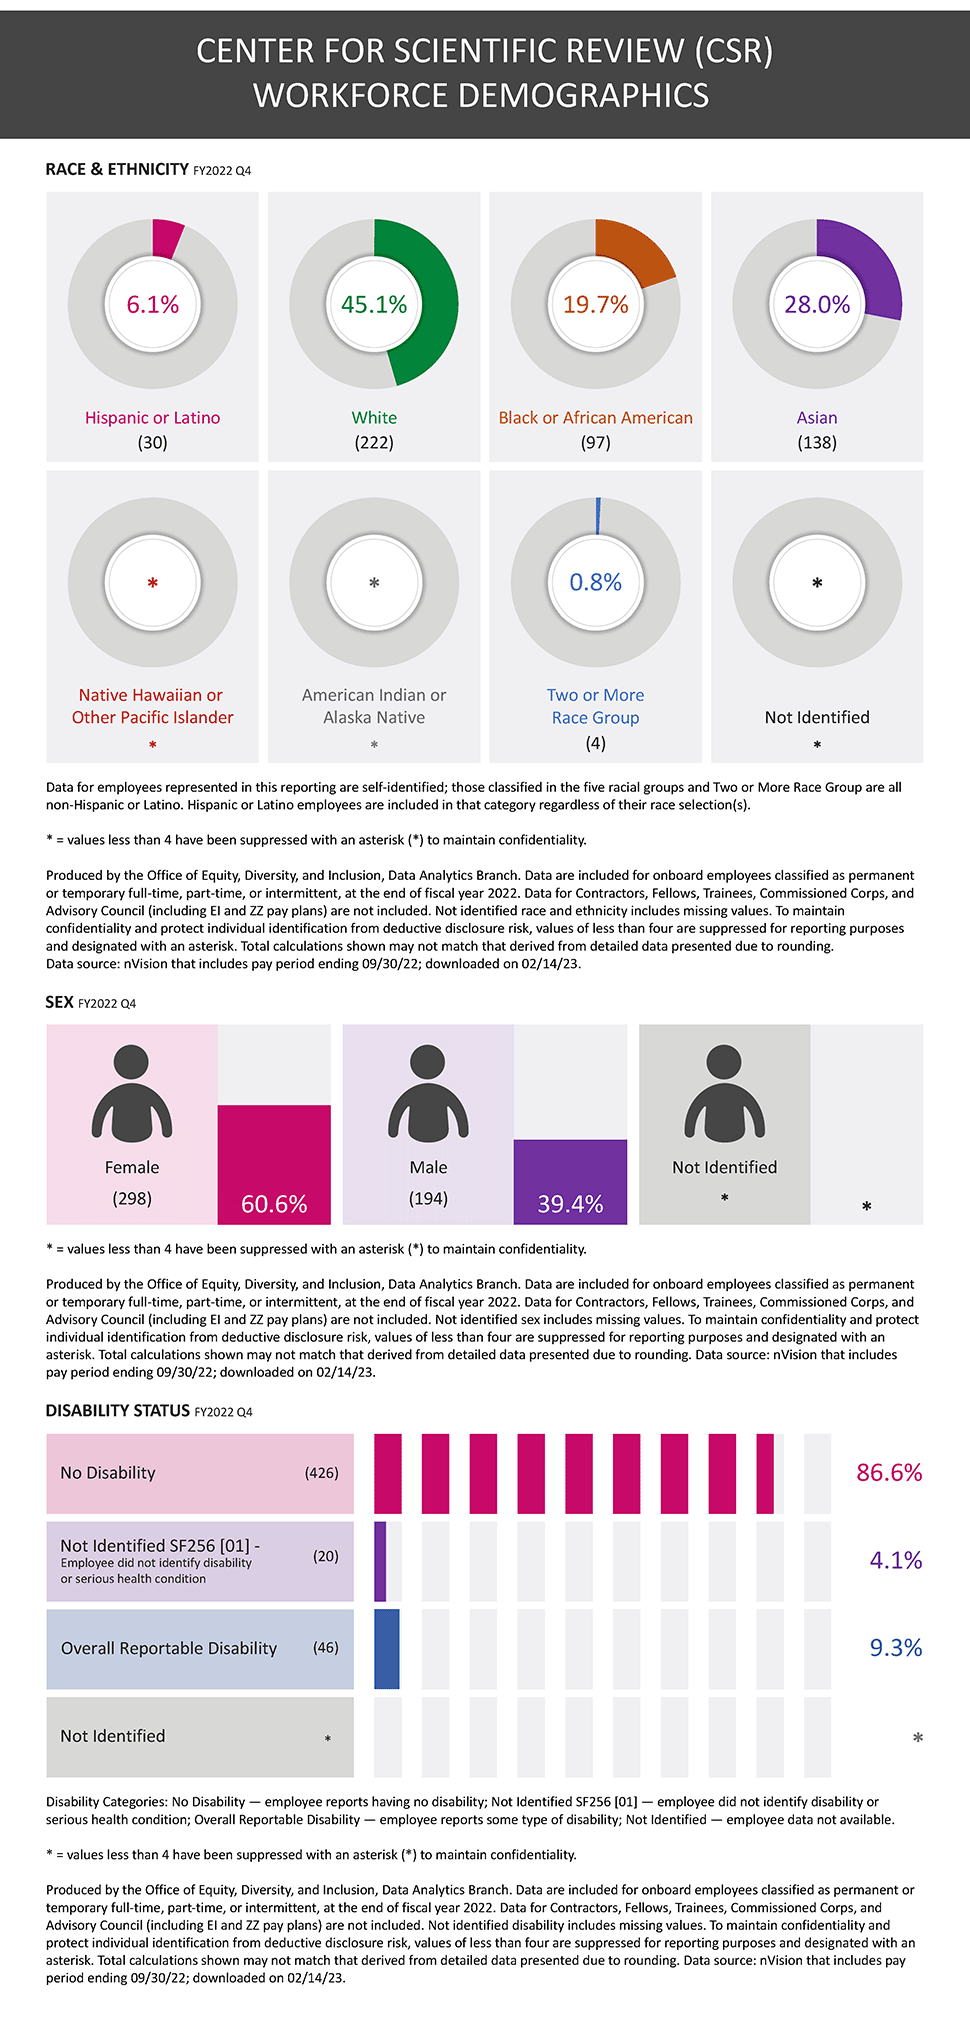
National Institutes of Health Center for Scientific Review Workforce Demographics
RACE & ETHNICITY: Workforce Demographics by Race and Ethnicity. Graphic showing the proportions of Hispanic or Latino, White, Black or African American, Asian, Native Hawaiian or Other Pacific Islander, American Indian or Alaska Native, Two or More Race Group, and Not Identified NIH employees for Fiscal Year 2022 Fourth Quarter.
RACE & ETHNICITY: Hispanic or Latino = 30, 6.1%; White = 222, 45.1%; Black or African American = 97, 19.7%; Asian = 138, 28.0%; Native Hawaiian or Other Pacific Islander = *, *%; American Indian or Alaska Native = *, *%; Two or More Race Group = 4, 0.8%; Not Identified = *, *%
RACE & ETHNICITY: Data for employees represented in this reporting are self-identified; those classified in the five racial groups and Two or More Race Group are all non-Hispanic or Latino. Hispanic or Latino employees are included in that category regardless of their race selection(s).
SEX: Workforce Demographics by Sex. Graphic showing the proportions of Female and Male NIH employees for Fiscal Year 2022 Fourth Quarter.
SEX: FEMALE = 298, 60.6%; MALE = 194, 39.4%; Not Identified = *, *%
DISABILITY: Workforce Demographics by Disability Status. Graphic showing the proportions of NIH employees having disability status as the following: No Disability, Not Identified SF256 [01] – Employee did not identify disability or serious health condition, Overall Reportable Disability, and Not Identified NIH employees for Fiscal Year 2022 Fourth Quarter.
DISABILITY: No Disability = 426, 86.6%; Not Identified SF256 [01] – Employee did not identify disability or serious health condition = 20, 4.1%; Overall Reportable Disability = 46, 9.3%; Not Identified = *, *%
DISABILITY: Disability Categories: No Disability – employee reports having no disability; Not Identified SF256 [01] – employee did not identify disability or serious health condition; Overall Reportable Disability – employee reports some type of disability; Not Identified – employee data not available.
Produced by the Office of Equity, Diversity, and Inclusion, Data Analytics Branch. Data are included for onboard employees classified as permanent or temporary full-time, part-time, or intermittent, at the end of fiscal year 2022. Data for Contractors, Fellows, Trainees, Commissioned Corps, and Advisory Council (including EI and ZZ pay plans) are not included. Not identified race and ethnicity, sex, and disability include missing values. To maintain confidentiality and protect individual identification from deductive disclosure risk, values of less than four are suppressed for reporting purposes and designated with an asterisk. Total calculations shown may not match that derived from detailed data presented due to rounding. Data source: nVision that includes pay period ending 09/30/22; downloaded on 02/14/23.
Click graphic below to open full-size graphic in a new window.
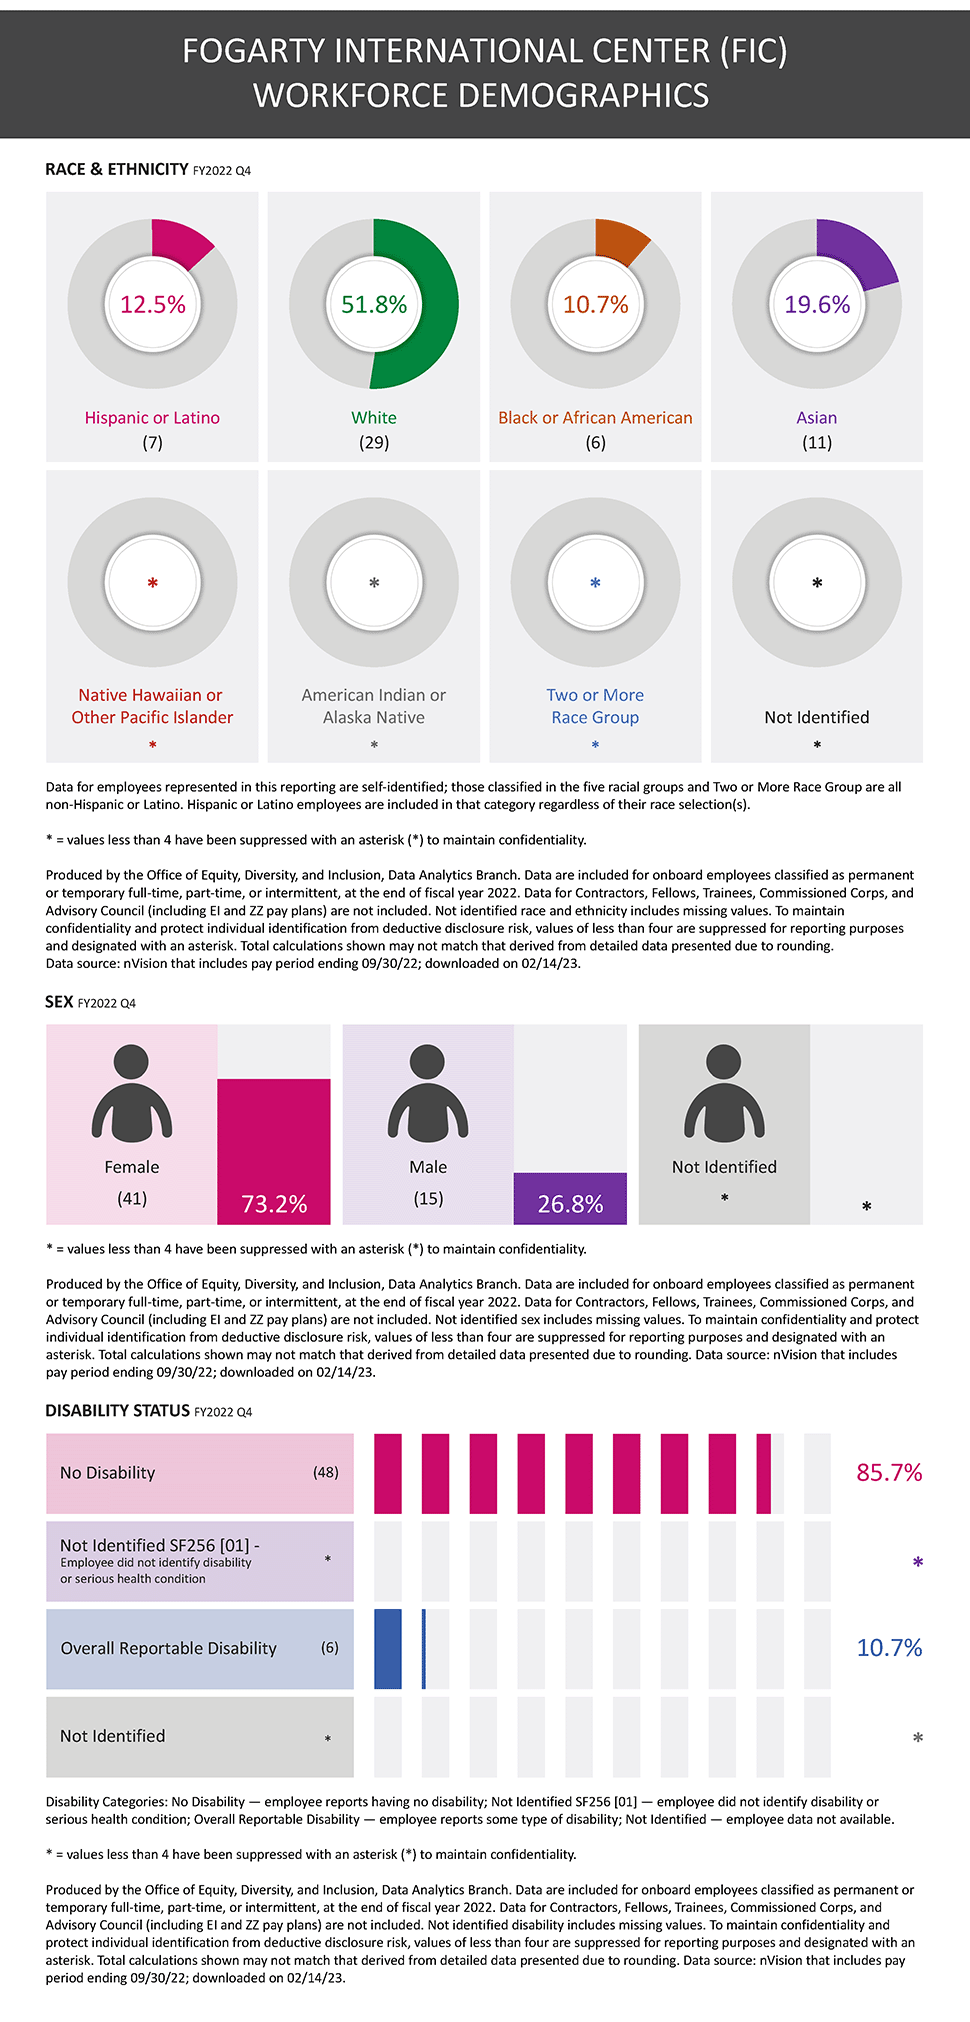
Fogarty International Center Workforce Demographics
RACE & ETHNICITY: Workforce Demographics by Race and Ethnicity. Graphic showing the proportions of Hispanic or Latino, White, Black or African American, Asian, Native Hawaiian or Other Pacific Islander, American Indian or Alaska Native, Two or More Race Group, and Not Identified NIH employees for Fiscal Year 2022 Fourth Quarter.
RACE & ETHNICITY: Hispanic or Latino = 7, 12.5%; White = 29, 51.8%; Black or African American = 6, 10.7%; Asian = 11, 19.6%; Native Hawaiian or Other Pacific Islander = *, *%; American Indian or Alaska Native = *, *%; Two or More Race Group = *, *%; Not Identified = *, *%
RACE & ETHNICITY: Data for employees represented in this reporting are self-identified; those classified in the five racial groups and Two or More Race Group are all non-Hispanic or Latino. Hispanic or Latino employees are included in that category regardless of their race selection(s).
SEX: Workforce Demographics by Sex. Graphic showing the proportions of Female and Male NIH employees for Fiscal Year 2022 Fourth Quarter.
SEX: FEMALE = 41, 73.2%; MALE = 15, 26.8%; Not Identified = *, *%
DISABILITY: Workforce Demographics by Disability Status. Graphic showing the proportions of NIH employees having disability status as the following: No Disability, Not Identified SF256 [01] – Employee did not identify disability or serious health condition, Overall Reportable Disability, and Not Identified NIH employees for Fiscal Year 2022 Fourth Quarter.
DISABILITY: No Disability = 48, 85.7%; Not Identified SF256 [01] – Employee did not identify disability or serious health condition = *, *%; Overall Reportable Disability = 6, 10.7%; Not Identified = *, *%
DISABILITY: Disability Categories: No Disability – employee reports having no disability; Not Identified SF256 [01] – employee did not identify disability or serious health condition; Overall Reportable Disability – employee reports some type of disability; Not Identified – employee data not available.
Produced by the Office of Equity, Diversity, and Inclusion, Data Analytics Branch. Data are included for onboard employees classified as permanent or temporary full-time, part-time, or intermittent, at the end of fiscal year 2022. Data for Contractors, Fellows, Trainees, Commissioned Corps, and Advisory Council (including EI and ZZ pay plans) are not included. Not identified race and ethnicity, sex, and disability include missing values. To maintain confidentiality and protect individual identification from deductive disclosure risk, values of less than four are suppressed for reporting purposes and designated with an asterisk. Total calculations shown may not match that derived from detailed data presented due to rounding. Data source: nVision that includes pay period ending 09/30/22; downloaded on 02/14/23.
Click graphic below to open full-size graphic in a new window.
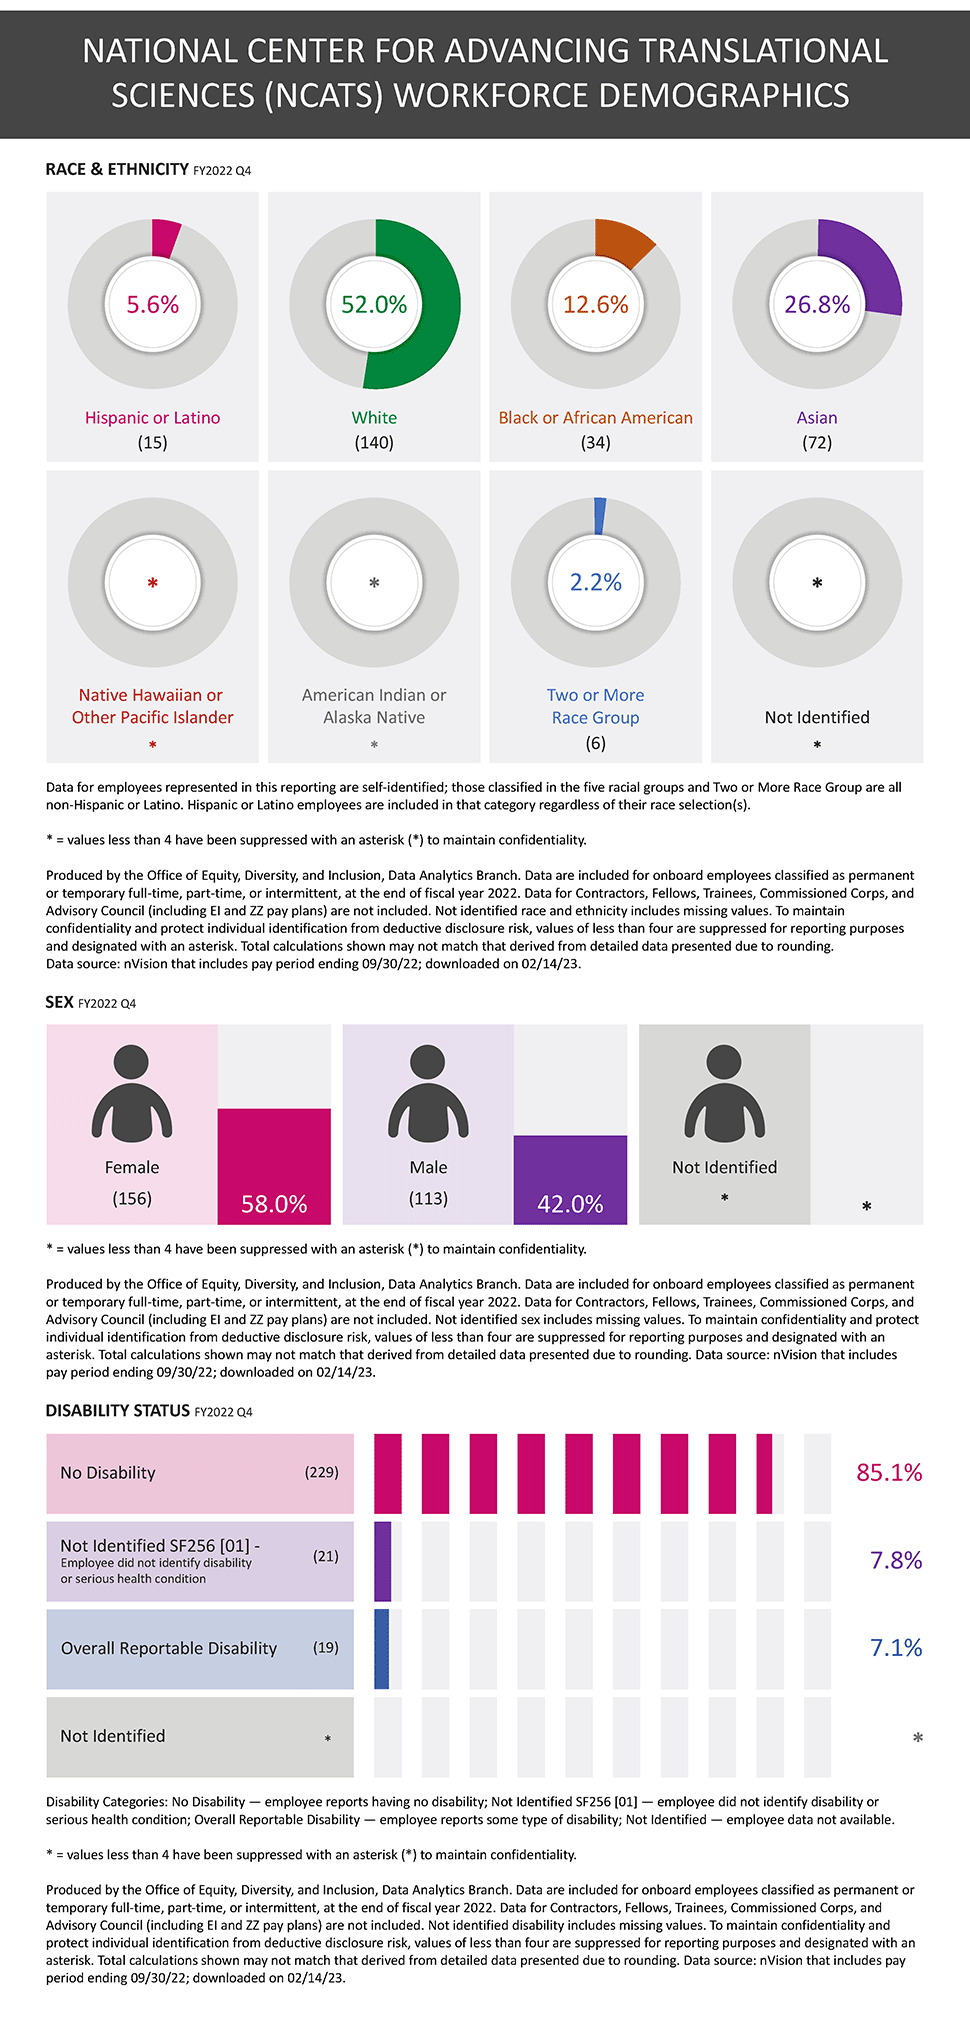
National Center for Advancing Translational Sciences Workforce Demographics
RACE & ETHNICITY: Workforce Demographics by Race and Ethnicity. Graphic showing the proportions of Hispanic or Latino, White, Black or African American, Asian, Native Hawaiian or Other Pacific Islander, American Indian or Alaska Native, Two or More Race Group, and Not Identified NIH employees for Fiscal Year 2022 Fourth Quarter.
RACE & ETHNICITY: Hispanic or Latino = 15, 5.6%; White = 140, 52.0%; Black or African American = 34, 12.6%; Asian = 72, 26.8%; Native Hawaiian or Other Pacific Islander = *, *%; American Indian or Alaska Native = *, *%; Two or More Race Group = 6, 2.2%; Not Identified = *, *%
RACE & ETHNICITY: Data for employees represented in this reporting are self-identified; those classified in the five racial groups and Two or More Race Group are all non-Hispanic or Latino. Hispanic or Latino employees are included in that category regardless of their race selection(s).
SEX: Workforce Demographics by Sex. Graphic showing the proportions of Female and Male NIH employees for Fiscal Year 2022 Fourth Quarter.
SEX: FEMALE = 156, 58.0%; MALE = 113, 42.0%; Not Identified = *, *%
DISABILITY: Workforce Demographics by Disability Status. Graphic showing the proportions of NIH employees having disability status as the following: No Disability, Not Identified SF256 [01] – Employee did not identify disability or serious health condition, Overall Reportable Disability, and Not Identified NIH employees for Fiscal Year 2022 Fourth Quarter.
DISABILITY: No Disability = 229, 85.1%; Not Identified SF256 [01] – Employee did not identify disability or serious health condition = 21, 7.8%; Overall Reportable Disability = 19, 7.1%; Not Identified = *, *%
DISABILITY: Disability Categories: No Disability – employee reports having no disability; Not Identified SF256 [01] – employee did not identify disability or serious health condition; Overall Reportable Disability – employee reports some type of disability; Not Identified – employee data not available.
Produced by the Office of Equity, Diversity, and Inclusion, Data Analytics Branch. Data are included for onboard employees classified as permanent or temporary full-time, part-time, or intermittent, at the end of fiscal year 2022. Data for Contractors, Fellows, Trainees, Commissioned Corps, and Advisory Council (including EI and ZZ pay plans) are not included. Not identified race and ethnicity, sex, and disability include missing values. To maintain confidentiality and protect individual identification from deductive disclosure risk, values of less than four are suppressed for reporting purposes and designated with an asterisk. Total calculations shown may not match that derived from detailed data presented due to rounding. Data source: nVision that includes pay period ending 09/30/22; downloaded on 02/14/23.
Click graphic below to open full-size graphic in a new window.
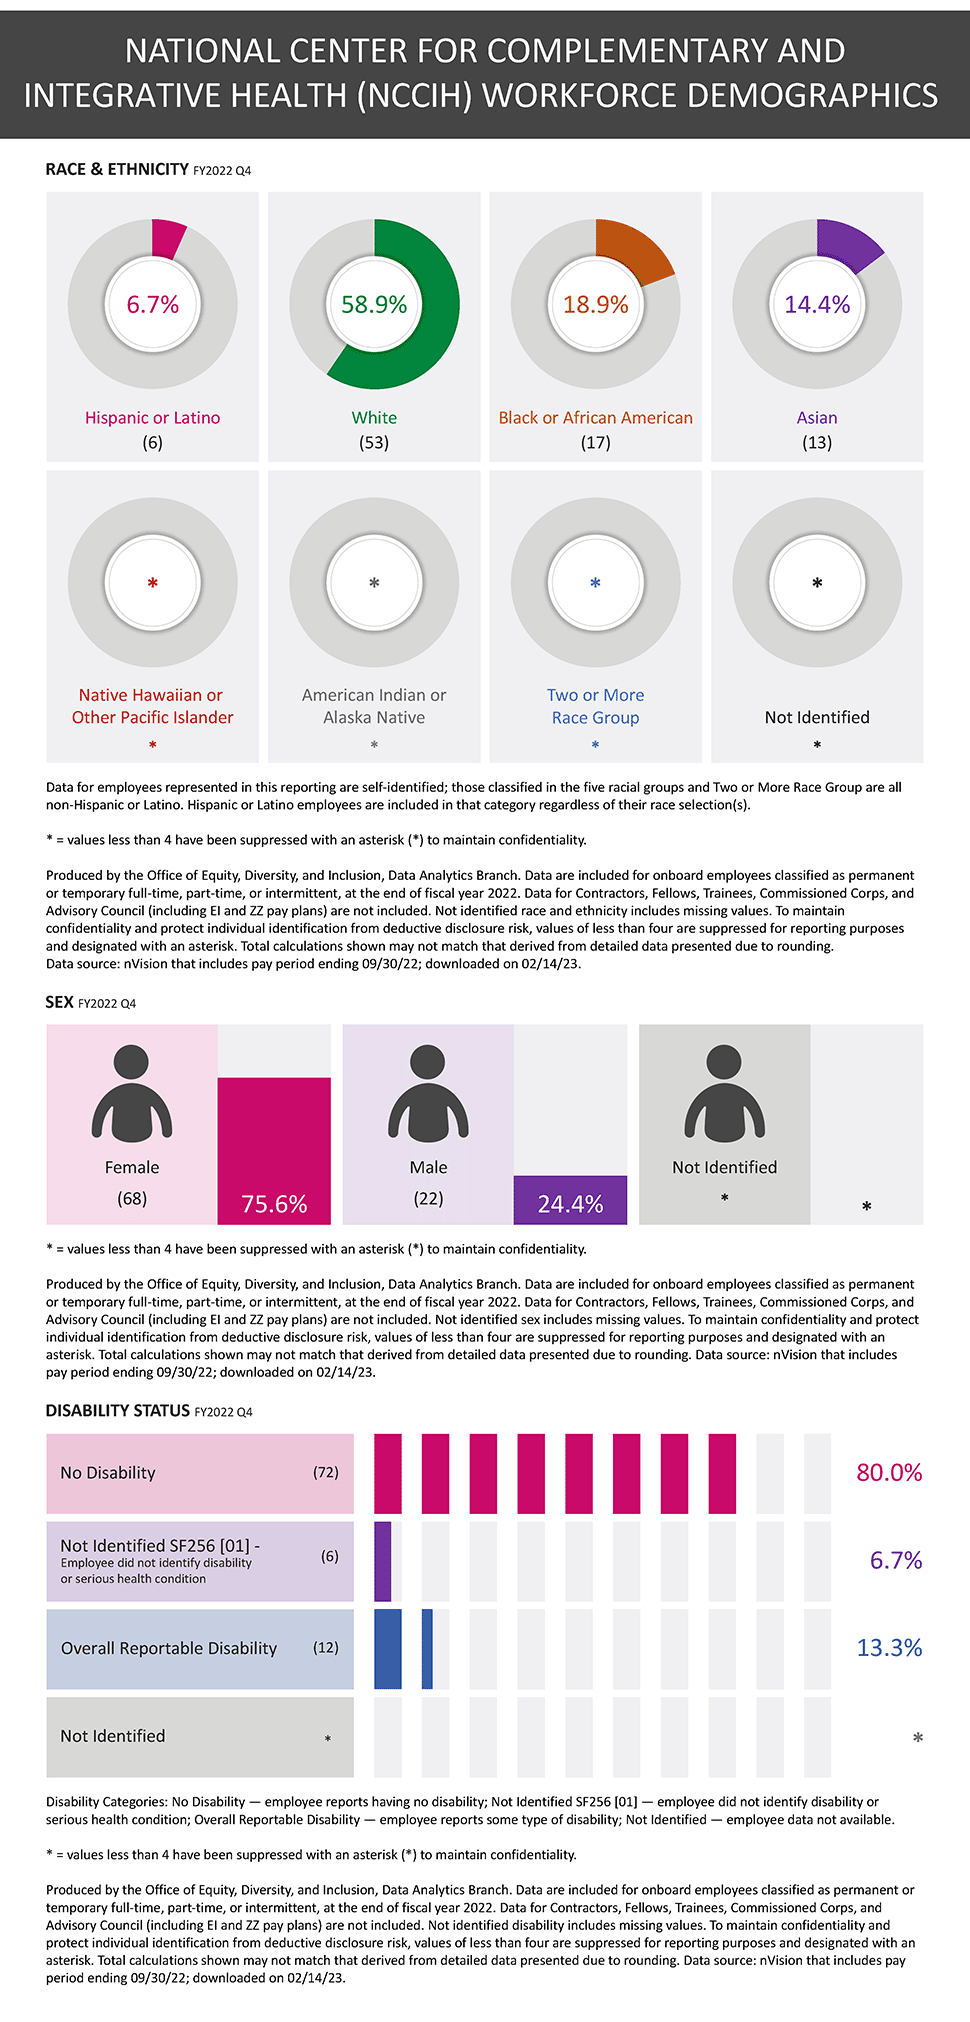
National Center for Complementary and Integrative Health Workforce Demographics
RACE & ETHNICITY: Workforce Demographics by Race and Ethnicity. Graphic showing the proportions of Hispanic or Latino, White, Black or African American, Asian, Native Hawaiian or Other Pacific Islander, American Indian or Alaska Native, Two or More Race Group, and Not Identified NIH employees for Fiscal Year 2022 Fourth Quarter.
RACE & ETHNICITY: Hispanic or Latino = 6, 6.7%; White = 53, 58.9%; Black or African American = 17, 18.9%; Asian = 13, 14.4%; Native Hawaiian or Other Pacific Islander = *, *%; American Indian or Alaska Native = *, *%; Two or More Race Group = *, *%; Not Identified = *, *%
RACE & ETHNICITY: Data for employees represented in this reporting are self-identified; those classified in the five racial groups and Two or More Race Group are all non-Hispanic or Latino. Hispanic or Latino employees are included in that category regardless of their race selection(s).
SEX: Workforce Demographics by Sex. Graphic showing the proportions of Female and Male NIH employees for Fiscal Year 2022 Fourth Quarter.
SEX: FEMALE = 68, 75.6%; MALE = 22, 24.4%; Not Identified = *, *%
DISABILITY: Workforce Demographics by Disability Status. Graphic showing the proportions of NIH employees having disability status as the following: No Disability, Not Identified SF256 [01] – Employee did not identify disability or serious health condition, Overall Reportable Disability, and Not Identified NIH employees for Fiscal Year 2022 Fourth Quarter.
DISABILITY: No Disability = 72, 80.0%; Not Identified SF256 [01] – Employee did not identify disability or serious health condition = 6, 6.7%; Overall Reportable Disability = 12, 13.3%; Not Identified = *, *%
DISABILITY: Disability Categories: No Disability – employee reports having no disability; Not Identified SF256 [01] – employee did not identify disability or serious health condition; Overall Reportable Disability – employee reports some type of disability; Not Identified – employee data not available.
Produced by the Office of Equity, Diversity, and Inclusion, Data Analytics Branch. Data are included for onboard employees classified as permanent or temporary full-time, part-time, or intermittent, at the end of fiscal year 2022. Data for Contractors, Fellows, Trainees, Commissioned Corps, and Advisory Council (including EI and ZZ pay plans) are not included. Not identified race and ethnicity, sex, and disability include missing values. To maintain confidentiality and protect individual identification from deductive disclosure risk, values of less than four are suppressed for reporting purposes and designated with an asterisk. Total calculations shown may not match that derived from detailed data presented due to rounding. Data source: nVision that includes pay period ending 09/30/22; downloaded on 02/14/23.
Click graphic below to open full-size graphic in a new window.
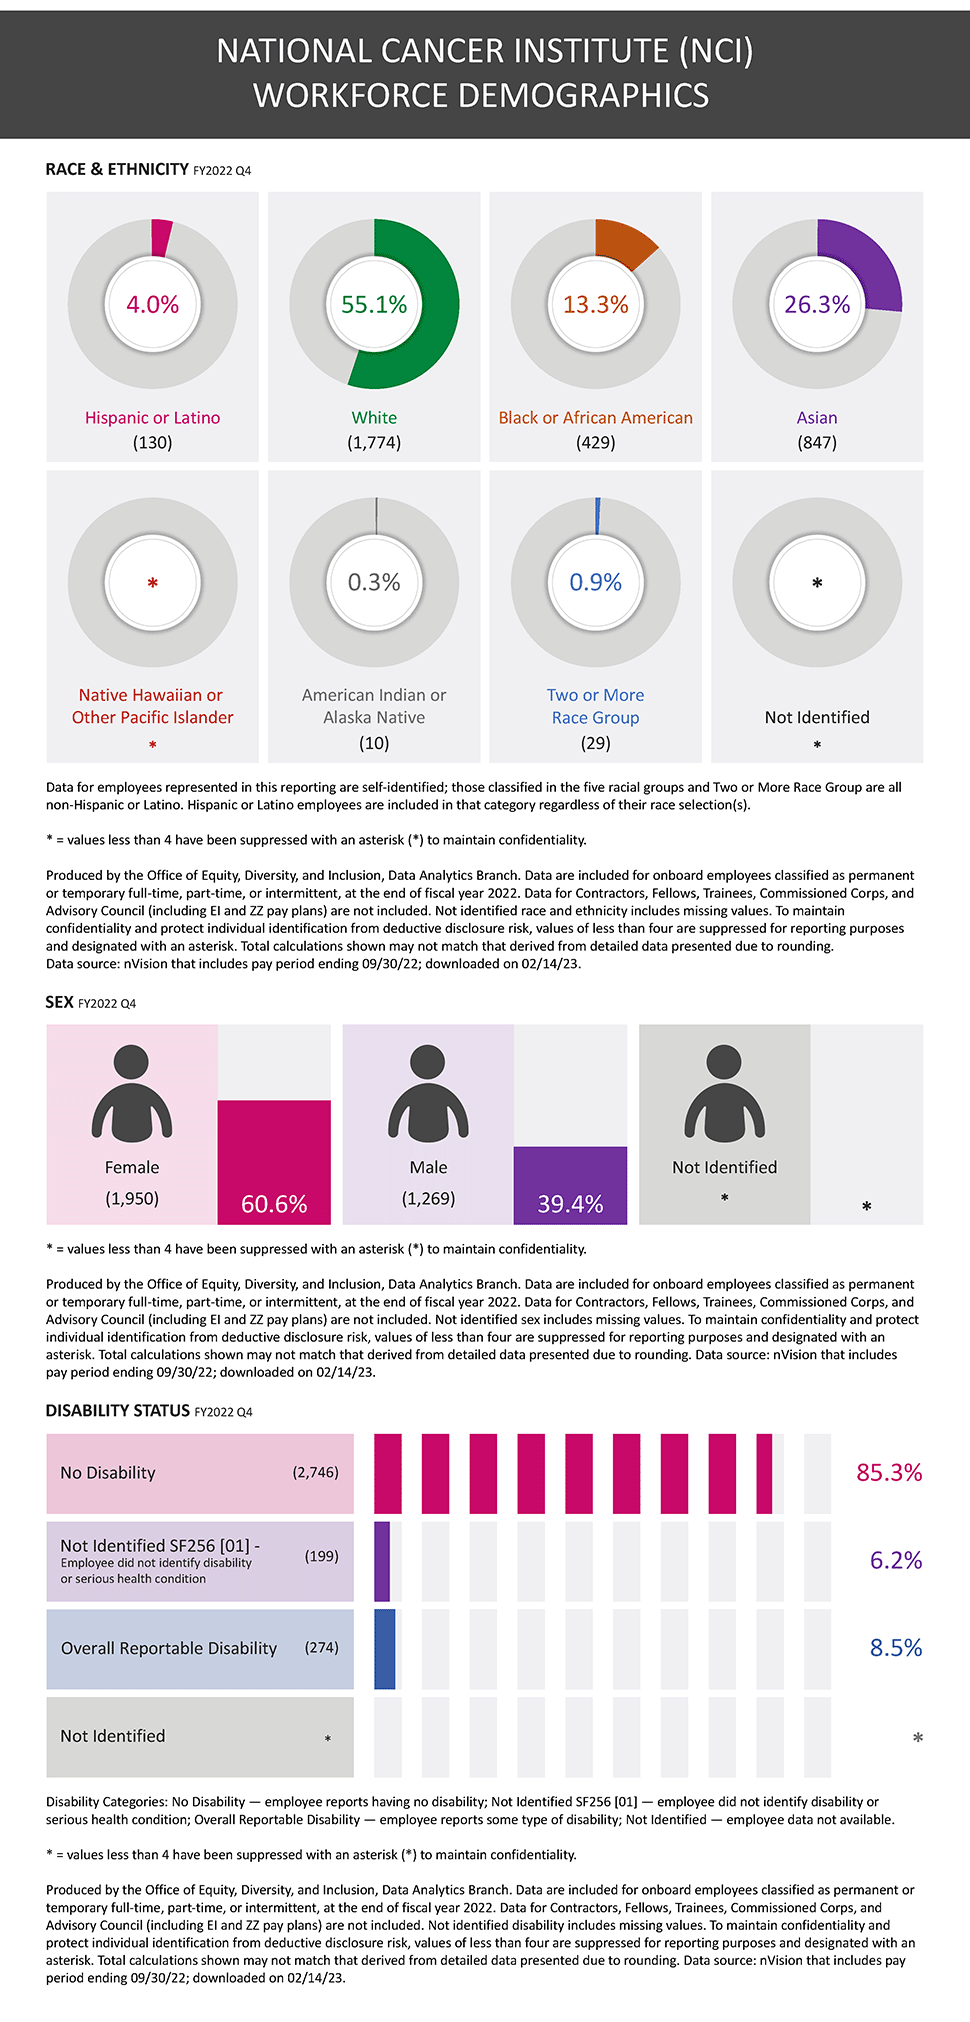
National Cancer Institute Workforce Demographics
RACE & ETHNICITY: Workforce Demographics by Race and Ethnicity. Graphic showing the proportions of Hispanic or Latino, White, Black or African American, Asian, Native Hawaiian or Other Pacific Islander, American Indian or Alaska Native, Two or More Race Group, and Not Identified NIH employees for Fiscal Year 2022 Fourth Quarter.
RACE & ETHNICITY: Hispanic or Latino = 130, 4.0%; White = 1774, 55.1%; Black or African American = 429, 13.3%; Asian = 847, 26.3%; Native Hawaiian or Other Pacific Islander = *, *%; American Indian or Alaska Native = 10, 0.3%; Two or More Race Group = 29, 0.9%; Not Identified = *, *%
RACE & ETHNICITY: Data for employees represented in this reporting are self-identified; those classified in the five racial groups and Two or More Race Group are all non-Hispanic or Latino. Hispanic or Latino employees are included in that category regardless of their race selection(s).
SEX: Workforce Demographics by Sex. Graphic showing the proportions of Female and Male NIH employees for Fiscal Year 2022 Fourth Quarter.
SEX: FEMALE = 1950, 60.6%; MALE = 1269, 39.4%; Not Identified = *, *%
DISABILITY: Workforce Demographics by Disability Status. Graphic showing the proportions of NIH employees having disability status as the following: No Disability, Not Identified SF256 [01] – Employee did not identify disability or serious health condition, Overall Reportable Disability, and Not Identified NIH employees for Fiscal Year 2022 Fourth Quarter.
DISABILITY: No Disability = 2746, 85.3%; Not Identified SF256 [01] – Employee did not identify disability or serious health condition = 199, 6.2%; Overall Reportable Disability = 274, 8.5%; Not Identified = *, *%
DISABILITY: Disability Categories: No Disability – employee reports having no disability; Not Identified SF256 [01] – employee did not identify disability or serious health condition; Overall Reportable Disability – employee reports some type of disability; Not Identified – employee data not available.
Produced by the Office of Equity, Diversity, and Inclusion, Data Analytics Branch. Data are included for onboard employees classified as permanent or temporary full-time, part-time, or intermittent, at the end of fiscal year 2022. Data for Contractors, Fellows, Trainees, Commissioned Corps, and Advisory Council (including EI and ZZ pay plans) are not included. Not identified race and ethnicity, sex, and disability include missing values. To maintain confidentiality and protect individual identification from deductive disclosure risk, values of less than four are suppressed for reporting purposes and designated with an asterisk. Total calculations shown may not match that derived from detailed data presented due to rounding. Data source: nVision that includes pay period ending 09/30/22; downloaded on 02/14/23.
Click graphic below to open full-size graphic in a new window.
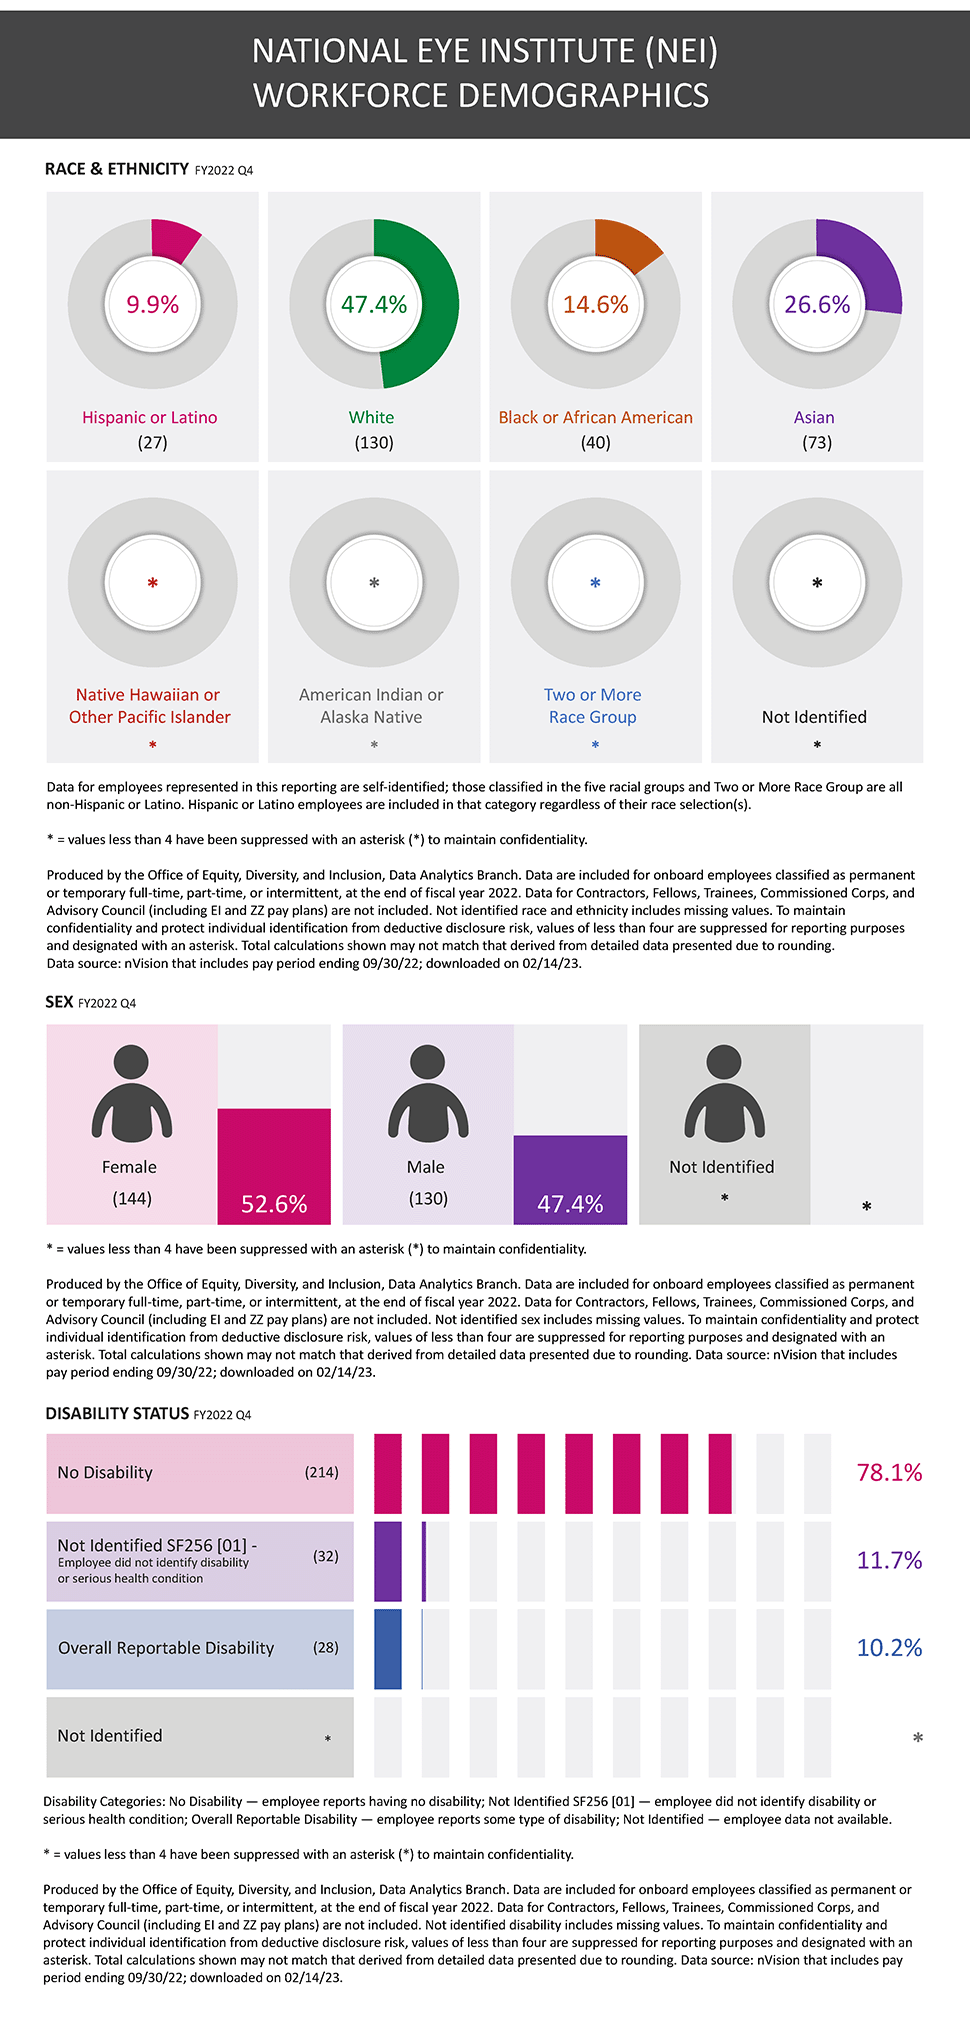
National Eye Institute Workforce Demographics
RACE & ETHNICITY: Workforce Demographics by Race and Ethnicity. Graphic showing the proportions of Hispanic or Latino, White, Black or African American, Asian, Native Hawaiian or Other Pacific Islander, American Indian or Alaska Native, Two or More Race Group, and Not Identified NIH employees for Fiscal Year 2022 Fourth Quarter.
RACE & ETHNICITY: Hispanic or Latino = 27, 9.9%; White = 130, 47.4%; Black or African American = 40, 14.6%; Asian = 73, 26.6%; Native Hawaiian or Other Pacific Islander = *, *%; American Indian or Alaska Native = *, *%; Two or More Race Group = *, *%; Not Identified = *, *%
RACE & ETHNICITY: Data for employees represented in this reporting are self-identified; those classified in the five racial groups and Two or More Race Group are all non-Hispanic or Latino. Hispanic or Latino employees are included in that category regardless of their race selection(s).
SEX: Workforce Demographics by Sex. Graphic showing the proportions of Female and Male NIH employees for Fiscal Year 2022 Fourth Quarter.
SEX: FEMALE = 144, 52.6%; MALE = 130, 47.4%; Not Identified = *, *%
DISABILITY: Workforce Demographics by Disability Status. Graphic showing the proportions of NIH employees having disability status as the following: No Disability, Not Identified SF256 [01] – Employee did not identify disability or serious health condition, Overall Reportable Disability, and Not Identified NIH employees for Fiscal Year 2022 Fourth Quarter.
DISABILITY: No Disability = 214, 78.1%; Not Identified SF256 [01] – Employee did not identify disability or serious health condition = 32, 11.7%; Overall Reportable Disability = 28, 10.2%; Not Identified = *, *%
DISABILITY: Disability Categories: No Disability – employee reports having no disability; Not Identified SF256 [01] – employee did not identify disability or serious health condition; Overall Reportable Disability – employee reports some type of disability; Not Identified – employee data not available.
Produced by the Office of Equity, Diversity, and Inclusion, Data Analytics Branch. Data are included for onboard employees classified as permanent or temporary full-time, part-time, or intermittent, at the end of fiscal year 2022. Data for Contractors, Fellows, Trainees, Commissioned Corps, and Advisory Council (including EI and ZZ pay plans) are not included. Not identified race and ethnicity, sex, and disability include missing values. To maintain confidentiality and protect individual identification from deductive disclosure risk, values of less than four are suppressed for reporting purposes and designated with an asterisk. Total calculations shown may not match that derived from detailed data presented due to rounding. Data source: nVision that includes pay period ending 09/30/22; downloaded on 02/14/23.
Click graphic below to open full-size graphic in a new window.
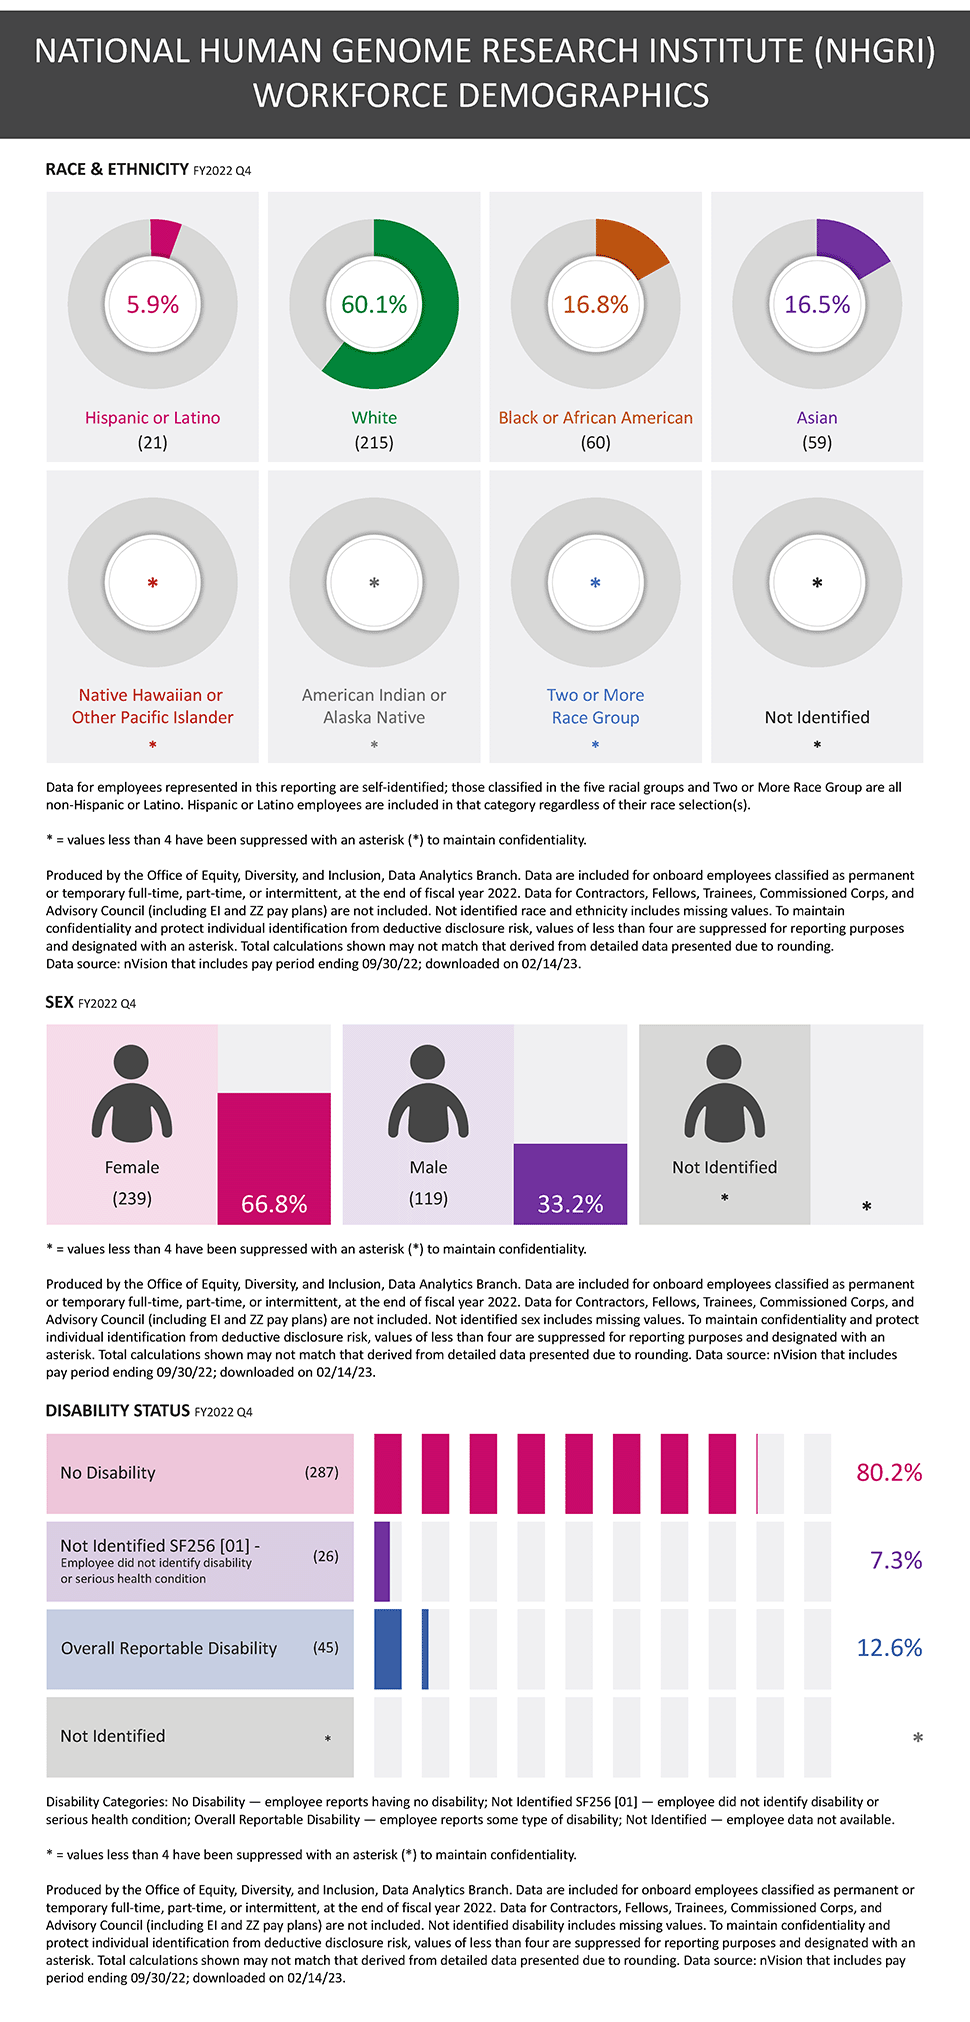
National Human Genome Research Institute Workforce Demographics
RACE & ETHNICITY: Workforce Demographics by Race and Ethnicity. Graphic showing the proportions of Hispanic or Latino, White, Black or African American, Asian, Native Hawaiian or Other Pacific Islander, American Indian or Alaska Native, Two or More Race Group, and Not Identified NIH employees for Fiscal Year 2022 Fourth Quarter.
RACE & ETHNICITY: Hispanic or Latino = 21, 5.9%; White = 215, 60.1%; Black or African American = 60, 16.8%; Asian = 59, 16.5%; Native Hawaiian or Other Pacific Islander = *, *%; American Indian or Alaska Native = *, *%; Two or More Race Group = *, *%; Not Identified = *, *%
RACE & ETHNICITY: Data for employees represented in this reporting are self-identified; those classified in the five racial groups and Two or More Race Group are all non-Hispanic or Latino. Hispanic or Latino employees are included in that category regardless of their race selection(s).
SEX: Workforce Demographics by Sex. Graphic showing the proportions of Female and Male NIH employees for Fiscal Year 2022 Fourth Quarter.
SEX: FEMALE = 239, 66.8%; MALE = 119, 33.2%; Not Identified = *, *%
DISABILITY: Workforce Demographics by Disability Status. Graphic showing the proportions of NIH employees having disability status as the following: No Disability, Not Identified SF256 [01] – Employee did not identify disability or serious health condition, Overall Reportable Disability, and Not Identified NIH employees for Fiscal Year 2022 Fourth Quarter.
DISABILITY: No Disability = 287, 80.2%; Not Identified SF256 [01] – Employee did not identify disability or serious health condition = 26, 7.3%; Overall Reportable Disability = 45, 12.6%; Not Identified = *, *%
DISABILITY: Disability Categories: No Disability – employee reports having no disability; Not Identified SF256 [01] – employee did not identify disability or serious health condition; Overall Reportable Disability – employee reports some type of disability; Not Identified – employee data not available.
Produced by the Office of Equity, Diversity, and Inclusion, Data Analytics Branch. Data are included for onboard employees classified as permanent or temporary full-time, part-time, or intermittent, at the end of fiscal year 2022. Data for Contractors, Fellows, Trainees, Commissioned Corps, and Advisory Council (including EI and ZZ pay plans) are not included. Not identified race and ethnicity, sex, and disability include missing values. To maintain confidentiality and protect individual identification from deductive disclosure risk, values of less than four are suppressed for reporting purposes and designated with an asterisk. Total calculations shown may not match that derived from detailed data presented due to rounding. Data source: nVision that includes pay period ending 09/30/22; downloaded on 02/14/23.
Click graphic below to open full-size graphic in a new window.
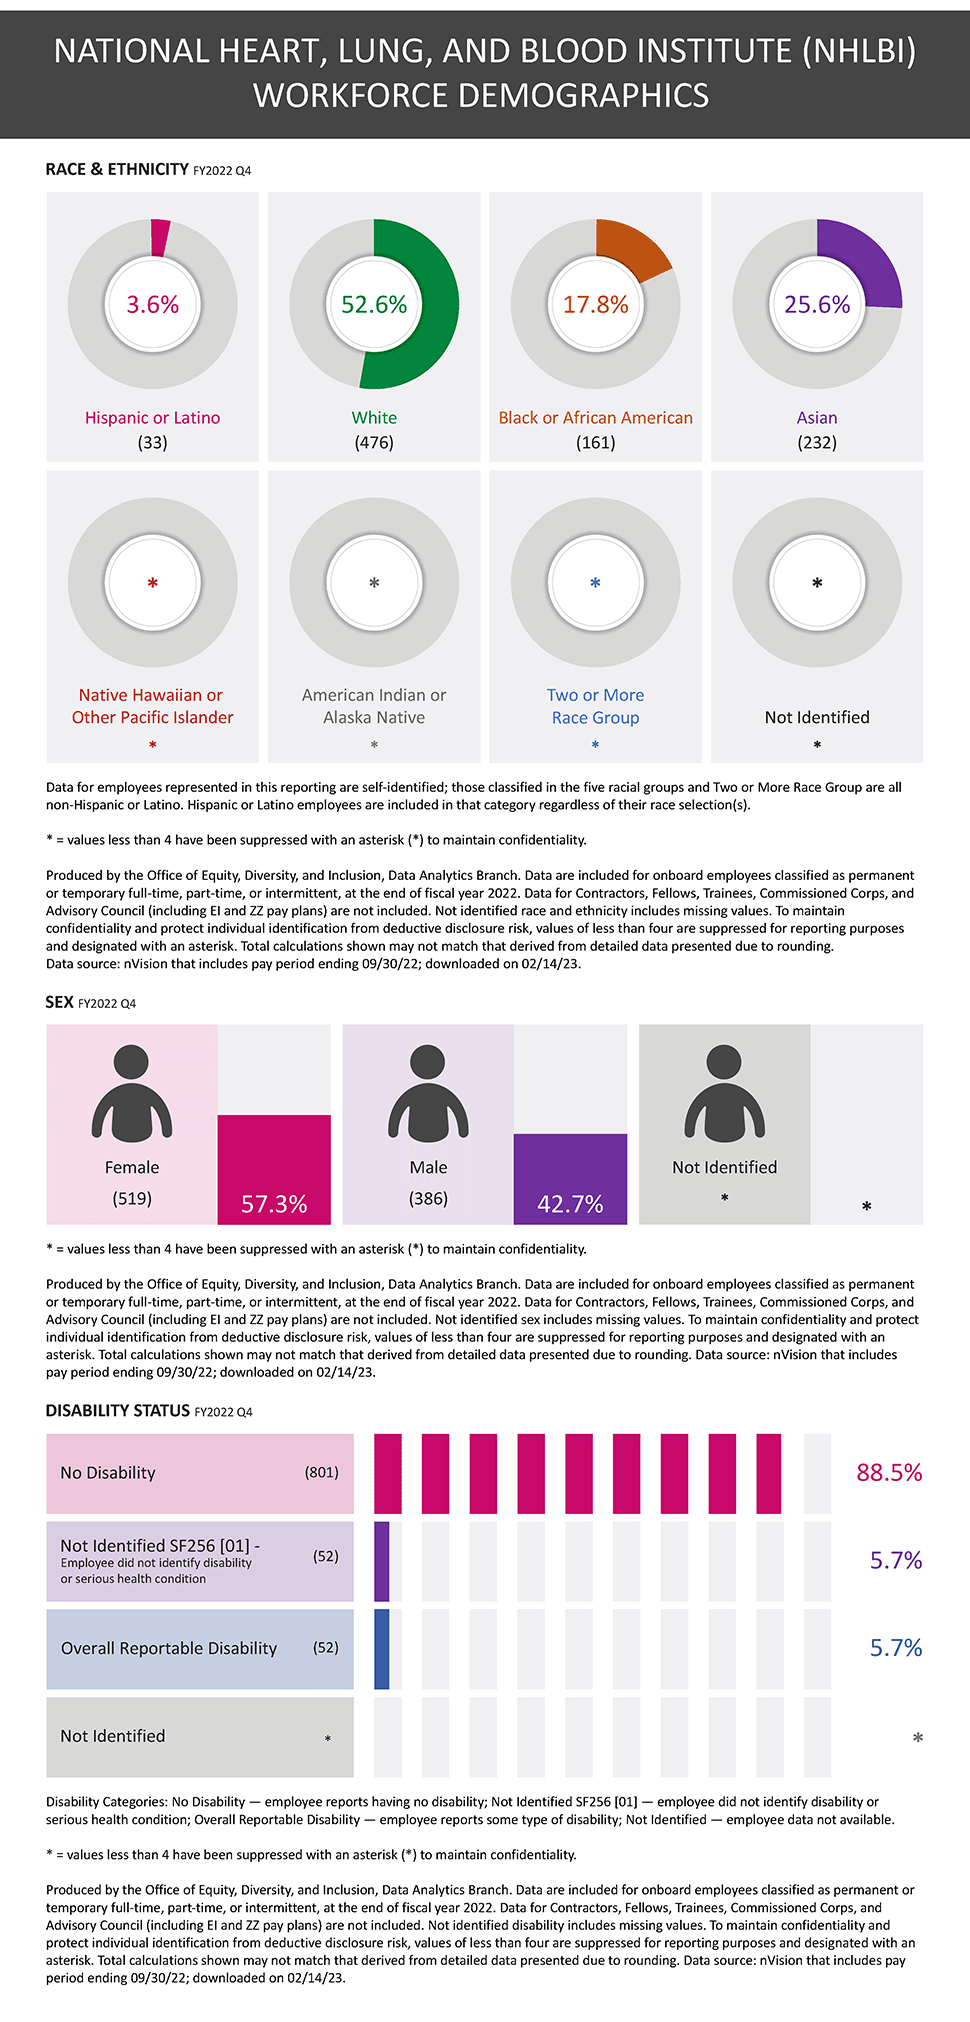
National Heart, Lung, and Blood Institute Workforce Demographics
RACE & ETHNICITY: Workforce Demographics by Race and Ethnicity. Graphic showing the proportions of Hispanic or Latino, White, Black or African American, Asian, Native Hawaiian or Other Pacific Islander, American Indian or Alaska Native, Two or More Race Group, and Not Identified NIH employees for Fiscal Year 2022 Fourth Quarter.
RACE & ETHNICITY: Hispanic or Latino = 33, 3.6%; White = 476, 52.6%; Black or African American = 161, 17.8%; Asian = 232, 25.6%; Native Hawaiian or Other Pacific Islander = *, *%; American Indian or Alaska Native = *, *%; Two or More Race Group = *, *%; Not Identified = *, *%
RACE & ETHNICITY: Data for employees represented in this reporting are self-identified; those classified in the five racial groups and Two or More Race Group are all non-Hispanic or Latino. Hispanic or Latino employees are included in that category regardless of their race selection(s).
SEX: Workforce Demographics by Sex. Graphic showing the proportions of Female and Male NIH employees for Fiscal Year 2022 Fourth Quarter.
SEX: FEMALE = 519, 57.3%; MALE = 386, 42.7%; Not Identified = *, *%
DISABILITY: Workforce Demographics by Disability Status. Graphic showing the proportions of NIH employees having disability status as the following: No Disability, Not Identified SF256 [01] – Employee did not identify disability or serious health condition, Overall Reportable Disability, and Not Identified NIH employees for Fiscal Year 2022 Fourth Quarter.
DISABILITY: No Disability = 801, 88.5%; Not Identified SF256 [01] – Employee did not identify disability or serious health condition = 52, 5.7%; Overall Reportable Disability = 52, 5.7%; Not Identified = *, *%
DISABILITY: Disability Categories: No Disability – employee reports having no disability; Not Identified SF256 [01] – employee did not identify disability or serious health condition; Overall Reportable Disability – employee reports some type of disability; Not Identified – employee data not available.
Produced by the Office of Equity, Diversity, and Inclusion, Data Analytics Branch. Data are included for onboard employees classified as permanent or temporary full-time, part-time, or intermittent, at the end of fiscal year 2022. Data for Contractors, Fellows, Trainees, Commissioned Corps, and Advisory Council (including EI and ZZ pay plans) are not included. Not identified race and ethnicity, sex, and disability include missing values. To maintain confidentiality and protect individual identification from deductive disclosure risk, values of less than four are suppressed for reporting purposes and designated with an asterisk. Total calculations shown may not match that derived from detailed data presented due to rounding. Data source: nVision that includes pay period ending 09/30/22; downloaded on 02/14/23.
Click graphic below to open full-size graphic in a new window.
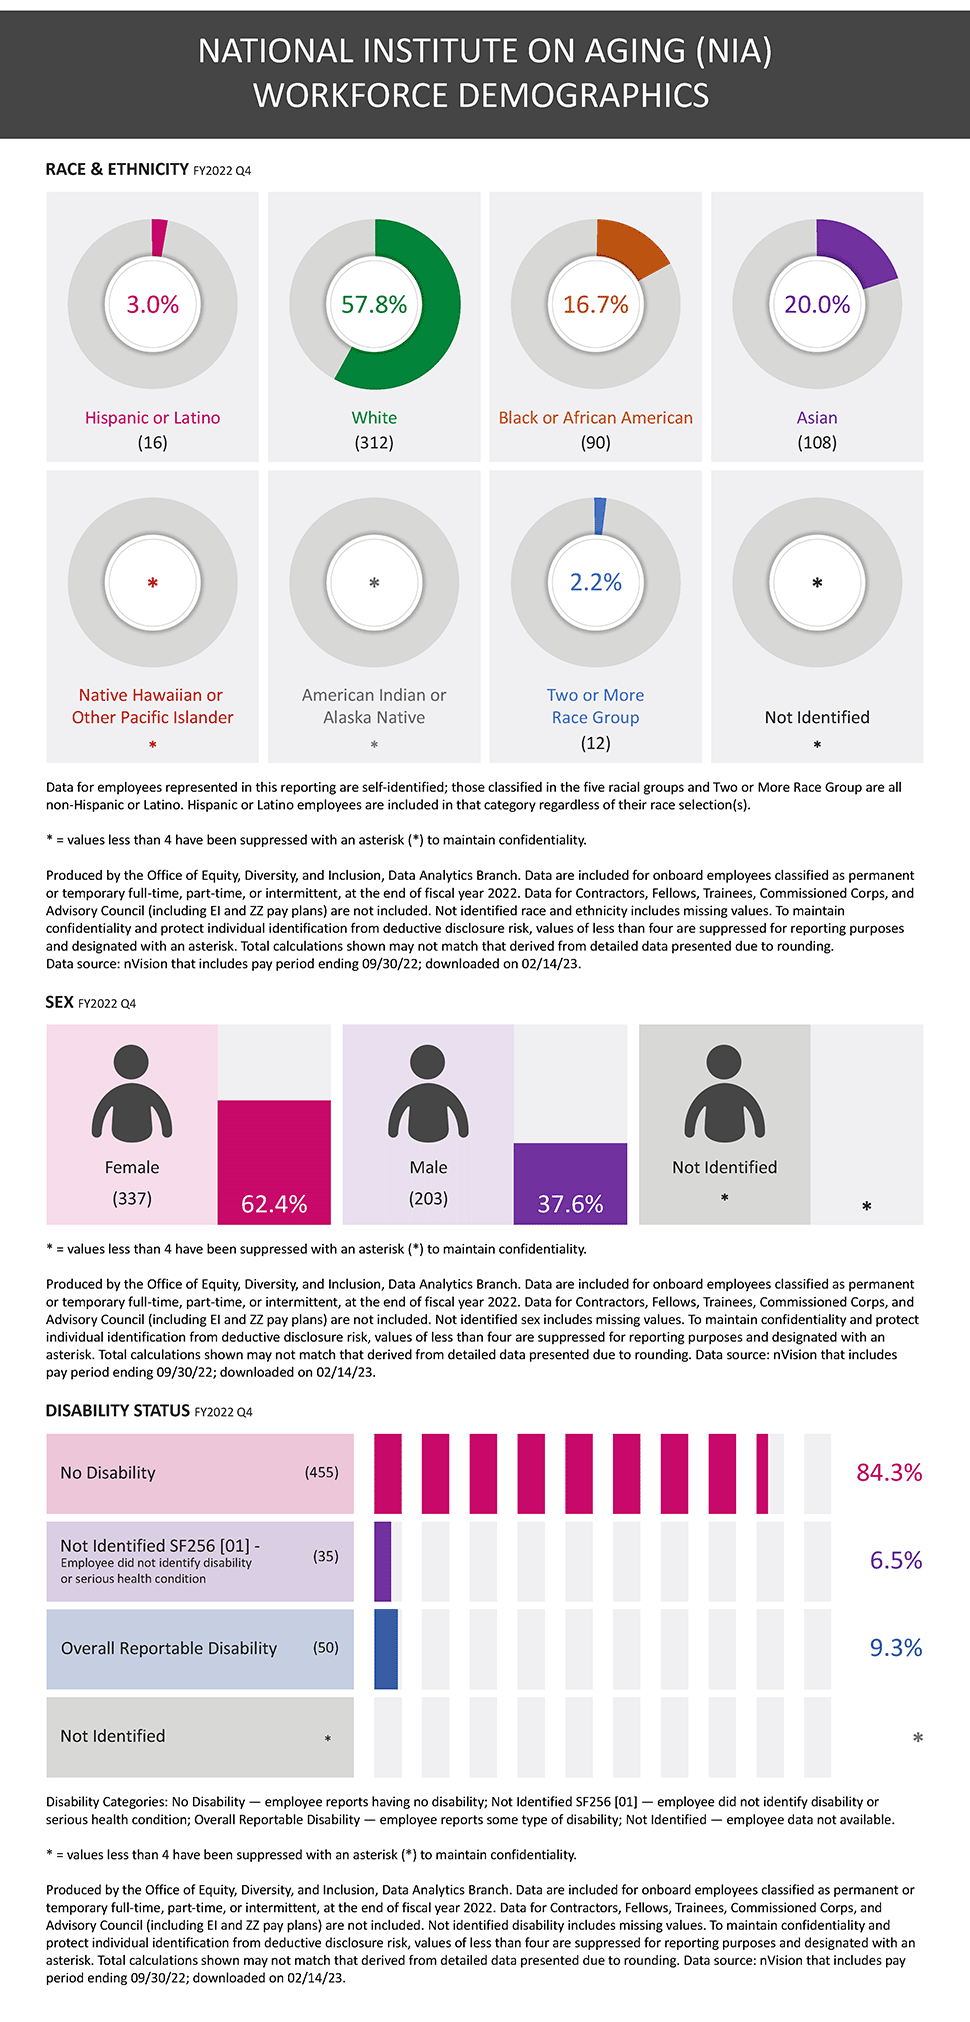
National Institute on Aging Workforce Demographics
RACE & ETHNICITY: Workforce Demographics by Race and Ethnicity. Graphic showing the proportions of Hispanic or Latino, White, Black or African American, Asian, Native Hawaiian or Other Pacific Islander, American Indian or Alaska Native, Two or More Race Group, and Not Identified NIH employees for Fiscal Year 2022 Fourth Quarter.
RACE & ETHNICITY: Hispanic or Latino = 16, 3.0%; White = 312, 57.8%; Black or African American = 90, 16.7%; Asian = 108, 20.0%; Native Hawaiian or Other Pacific Islander = *, *%; American Indian or Alaska Native = *, *%; Two or More Race Group = 12, 2.2%; Not Identified = *, *%
RACE & ETHNICITY: Data for employees represented in this reporting are self-identified; those classified in the five racial groups and Two or More Race Group are all non-Hispanic or Latino. Hispanic or Latino employees are included in that category regardless of their race selection(s).
SEX: Workforce Demographics by Sex. Graphic showing the proportions of Female and Male NIH employees for Fiscal Year 2022 Fourth Quarter.
SEX: FEMALE = 337, 62.4%; MALE = 203, 37.6%; Not Identified = *, *%
DISABILITY: Workforce Demographics by Disability Status. Graphic showing the proportions of NIH employees having disability status as the following: No Disability, Not Identified SF256 [01] – Employee did not identify disability or serious health condition, Overall Reportable Disability, and Not Identified NIH employees for Fiscal Year 2022 Fourth Quarter.
DISABILITY: No Disability = 455, 84.3%; Not Identified SF256 [01] – Employee did not identify disability or serious health condition = 35, 6.5%; Overall Reportable Disability = 50, 9.3%; Not Identified = *, *%
DISABILITY: Disability Categories: No Disability – employee reports having no disability; Not Identified SF256 [01] – employee did not identify disability or serious health condition; Overall Reportable Disability – employee reports some type of disability; Not Identified – employee data not available.
Produced by the Office of Equity, Diversity, and Inclusion, Data Analytics Branch. Data are included for onboard employees classified as permanent or temporary full-time, part-time, or intermittent, at the end of fiscal year 2022. Data for Contractors, Fellows, Trainees, Commissioned Corps, and Advisory Council (including EI and ZZ pay plans) are not included. Not identified race and ethnicity, sex, and disability include missing values. To maintain confidentiality and protect individual identification from deductive disclosure risk, values of less than four are suppressed for reporting purposes and designated with an asterisk. Total calculations shown may not match that derived from detailed data presented due to rounding. Data source: nVision that includes pay period ending 09/30/22; downloaded on 02/14/23.
Click graphic below to open full-size graphic in a new window.
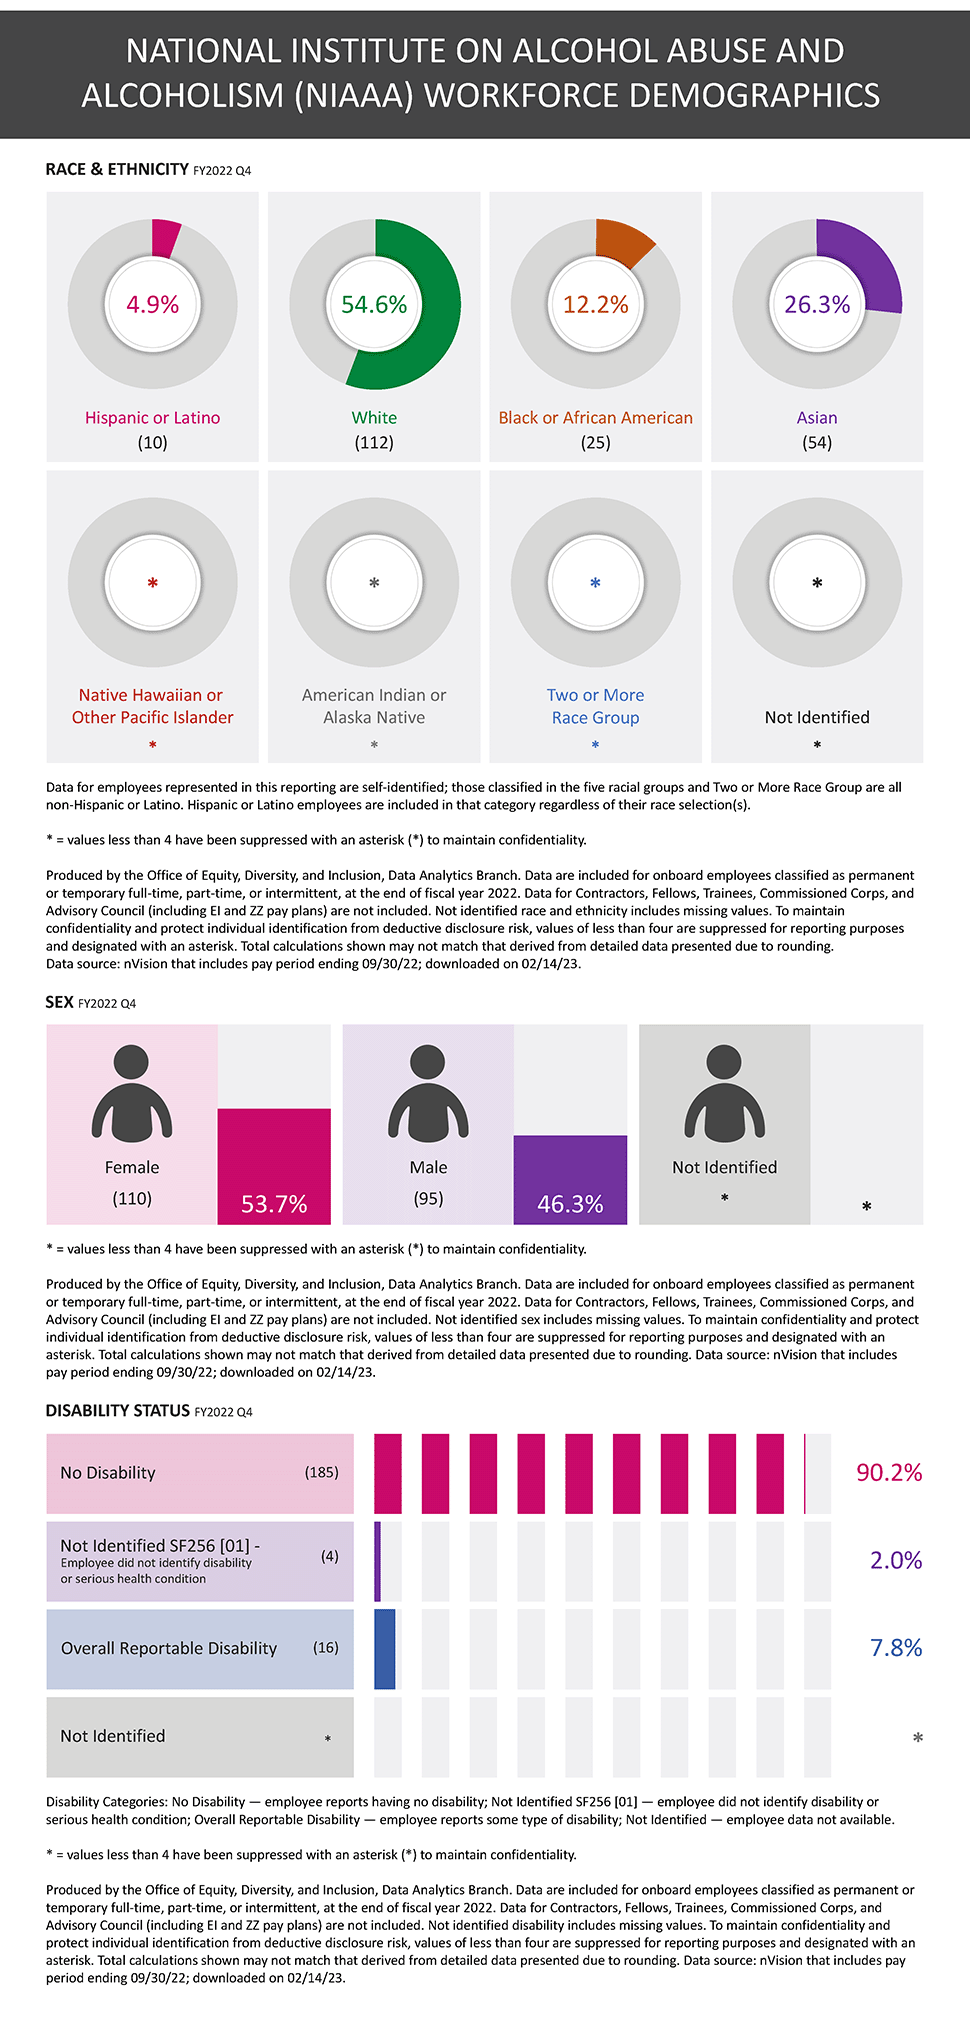
National Institute on Alcohol Abuse and Alcoholism Workforce Demographics
RACE & ETHNICITY: Workforce Demographics by Race and Ethnicity. Graphic showing the proportions of Hispanic or Latino, White, Black or African American, Asian, Native Hawaiian or Other Pacific Islander, American Indian or Alaska Native, Two or More Race Group, and Not Identified NIH employees for Fiscal Year 2022 Fourth Quarter.
RACE & ETHNICITY: Hispanic or Latino = 10, 4.9%; White = 112, 54.6%; Black or African American = 25, 12.2%; Asian = 54, 26.3%; Native Hawaiian or Other Pacific Islander = *, *%; American Indian or Alaska Native = *, *%; Two or More Race Group = *, *%; Not Identified = *, *%
RACE & ETHNICITY: Data for employees represented in this reporting are self-identified; those classified in the five racial groups and Two or More Race Group are all non-Hispanic or Latino. Hispanic or Latino employees are included in that category regardless of their race selection(s).
SEX: Workforce Demographics by Sex. Graphic showing the proportions of Female and Male NIH employees for Fiscal Year 2022 Fourth Quarter.
SEX: FEMALE = 110, 53.7%; MALE = 95, 46.3%; Not Identified = *, *%
DISABILITY: Workforce Demographics by Disability Status. Graphic showing the proportions of NIH employees having disability status as the following: No Disability, Not Identified SF256 [01] – Employee did not identify disability or serious health condition, Overall Reportable Disability, and Not Identified NIH employees for Fiscal Year 2022 Fourth Quarter.
DISABILITY: No Disability = 185, 90.2%; Not Identified SF256 [01] – Employee did not identify disability or serious health condition = 4, 2.0%; Overall Reportable Disability = 16, 7.8%; Not Identified = *, *%
DISABILITY: Disability Categories: No Disability – employee reports having no disability; Not Identified SF256 [01] – employee did not identify disability or serious health condition; Overall Reportable Disability – employee reports some type of disability; Not Identified – employee data not available.
Produced by the Office of Equity, Diversity, and Inclusion, Data Analytics Branch. Data are included for onboard employees classified as permanent or temporary full-time, part-time, or intermittent, at the end of fiscal year 2022. Data for Contractors, Fellows, Trainees, Commissioned Corps, and Advisory Council (including EI and ZZ pay plans) are not included. Not identified race and ethnicity, sex, and disability include missing values. To maintain confidentiality and protect individual identification from deductive disclosure risk, values of less than four are suppressed for reporting purposes and designated with an asterisk. Total calculations shown may not match that derived from detailed data presented due to rounding. Data source: nVision that includes pay period ending 09/30/22; downloaded on 02/14/23.
Click graphic below to open full-size graphic in a new window.
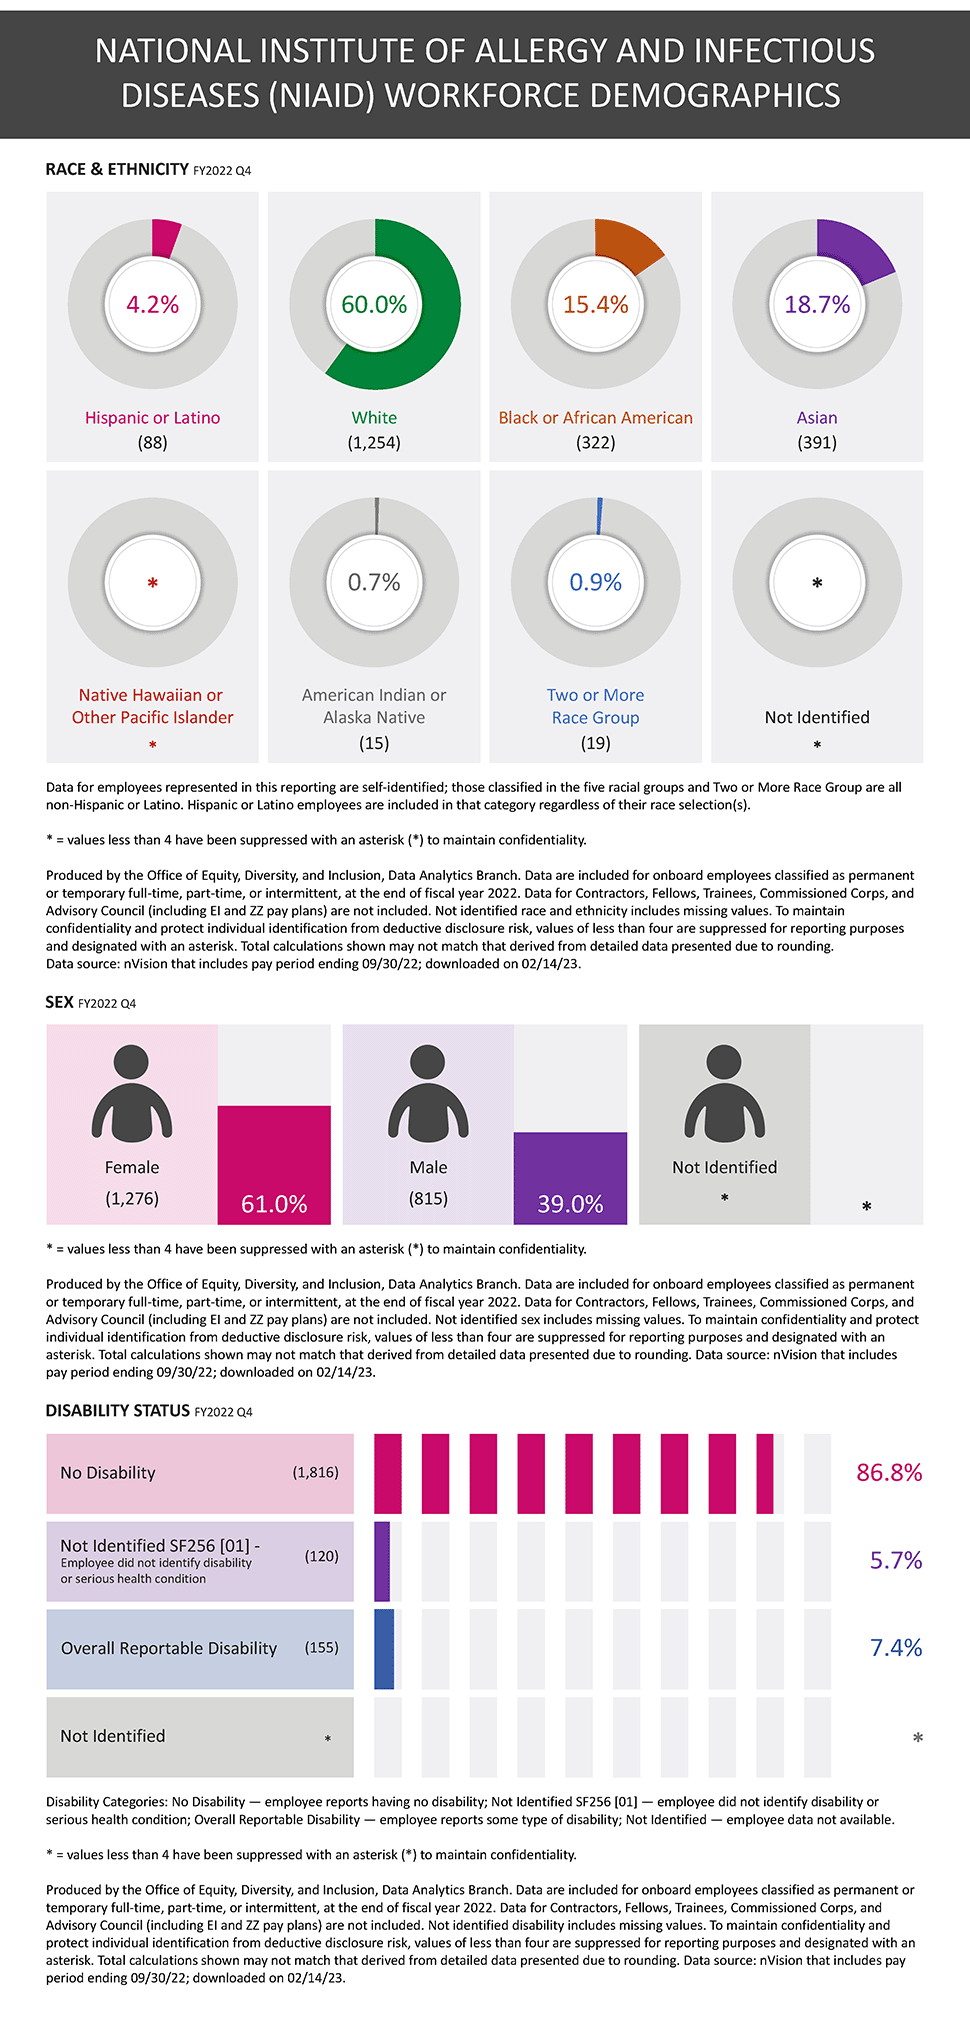
National Institute of Allergy and Infectious Diseases Workforce Demographics
RACE & ETHNICITY: Workforce Demographics by Race and Ethnicity. Graphic showing the proportions of Hispanic or Latino, White, Black or African American, Asian, Native Hawaiian or Other Pacific Islander, American Indian or Alaska Native, Two or More Race Group, and Not Identified NIH employees for Fiscal Year 2022 Fourth Quarter.
RACE & ETHNICITY: Hispanic or Latino = 88, 4.2%; White = 1254, 60.0%; Black or African American = 322, 15.4%; Asian = 391, 18.7%; Native Hawaiian or Other Pacific Islander = *, *%; American Indian or Alaska Native = 15, 0.7%; Two or More Race Group = 19, 0.9%; Not Identified = *, *%
RACE & ETHNICITY: Data for employees represented in this reporting are self-identified; those classified in the five racial groups and Two or More Race Group are all non-Hispanic or Latino. Hispanic or Latino employees are included in that category regardless of their race selection(s).
SEX: Workforce Demographics by Sex. Graphic showing the proportions of Female and Male NIH employees for Fiscal Year 2022 Fourth Quarter.
SEX: FEMALE = 1276, 61.0%; MALE = 815, 39.0%; Not Identified = *, *%
DISABILITY: Workforce Demographics by Disability Status. Graphic showing the proportions of NIH employees having disability status as the following: No Disability, Not Identified SF256 [01] – Employee did not identify disability or serious health condition, Overall Reportable Disability, and Not Identified NIH employees for Fiscal Year 2022 Fourth Quarter.
DISABILITY: No Disability = 1816, 86.8%; Not Identified SF256 [01] – Employee did not identify disability or serious health condition = 120, 5.7%; Overall Reportable Disability = 155, 7.4%; Not Identified = *, *%
DISABILITY: Disability Categories: No Disability – employee reports having no disability; Not Identified SF256 [01] – employee did not identify disability or serious health condition; Overall Reportable Disability – employee reports some type of disability; Not Identified – employee data not available.
Produced by the Office of Equity, Diversity, and Inclusion, Data Analytics Branch. Data are included for onboard employees classified as permanent or temporary full-time, part-time, or intermittent, at the end of fiscal year 2022. Data for Contractors, Fellows, Trainees, Commissioned Corps, and Advisory Council (including EI and ZZ pay plans) are not included. Not identified race and ethnicity, sex, and disability include missing values. To maintain confidentiality and protect individual identification from deductive disclosure risk, values of less than four are suppressed for reporting purposes and designated with an asterisk. Total calculations shown may not match that derived from detailed data presented due to rounding. Data source: nVision that includes pay period ending 09/30/22; downloaded on 02/14/23.
Click graphic below to open full-size graphic in a new window.
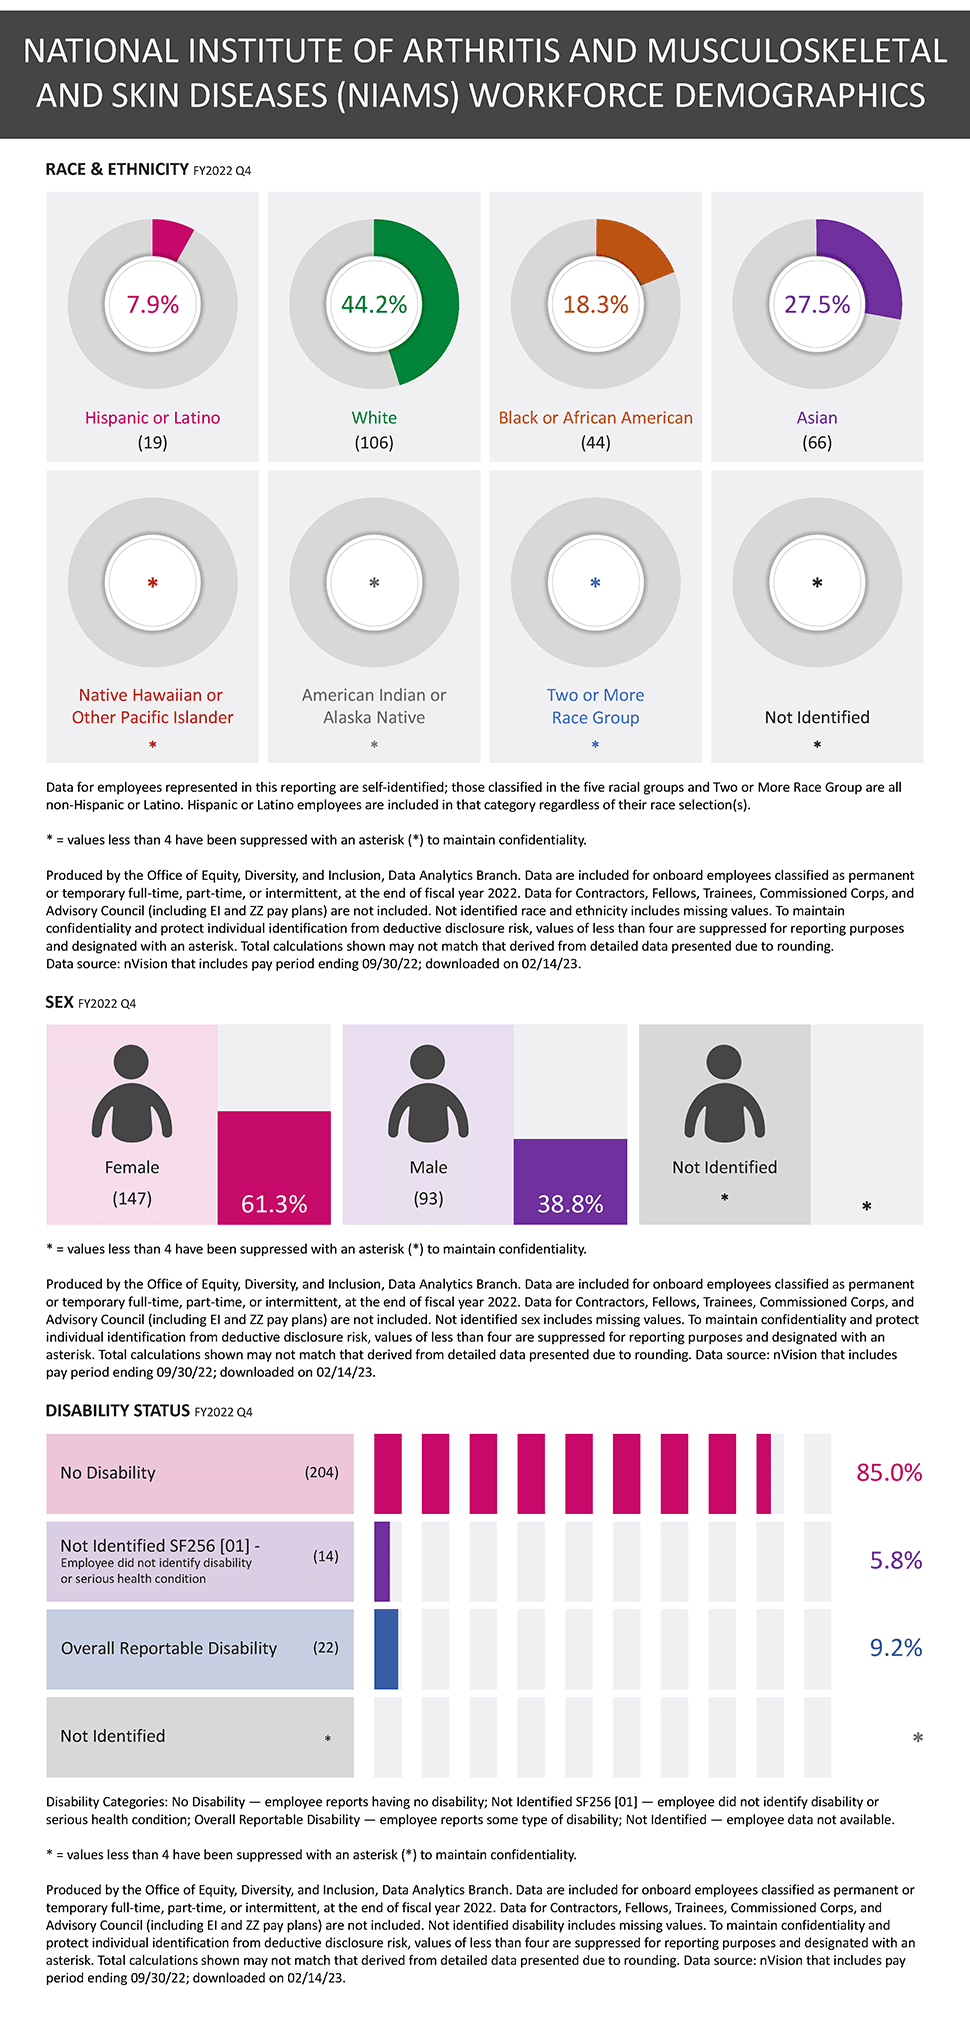
National Institute of Arthritis and Musculoskeletal and Skin Disease Workforce Demographics
RACE & ETHNICITY: Workforce Demographics by Race and Ethnicity. Graphic showing the proportions of Hispanic or Latino, White, Black or African American, Asian, Native Hawaiian or Other Pacific Islander, American Indian or Alaska Native, Two or More Race Group, and Not Identified NIH employees for Fiscal Year 2022 Fourth Quarter.
RACE & ETHNICITY: Hispanic or Latino = 19, 7.9%; White = 106, 44.2%; Black or African American = 44, 18.3%; Asian = 66, 27.5%; Native Hawaiian or Other Pacific Islander = *, *%; American Indian or Alaska Native = *, *%; Two or More Race Group = *, *%; Not Identified = *, *%
RACE & ETHNICITY: Data for employees represented in this reporting are self-identified; those classified in the five racial groups and Two or More Race Group are all non-Hispanic or Latino. Hispanic or Latino employees are included in that category regardless of their race selection(s).
SEX: Workforce Demographics by Sex. Graphic showing the proportions of Female and Male NIH employees for Fiscal Year 2022 Fourth Quarter.
SEX: FEMALE = 147, 61.3%; MALE = 93, 38.8%; Not Identified = *, *%
DISABILITY: Workforce Demographics by Disability Status. Graphic showing the proportions of NIH employees having disability status as the following: No Disability, Not Identified SF256 [01] – Employee did not identify disability or serious health condition, Overall Reportable Disability, and Not Identified NIH employees for Fiscal Year 2022 Fourth Quarter.
DISABILITY: No Disability = 204, 85.0%; Not Identified SF256 [01] – Employee did not identify disability or serious health condition = 14, 5.8%; Overall Reportable Disability = 22, 9.2%; Not Identified = *, *%
DISABILITY: Disability Categories: No Disability – employee reports having no disability; Not Identified SF256 [01] – employee did not identify disability or serious health condition; Overall Reportable Disability – employee reports some type of disability; Not Identified – employee data not available.
Produced by the Office of Equity, Diversity, and Inclusion, Data Analytics Branch. Data are included for onboard employees classified as permanent or temporary full-time, part-time, or intermittent, at the end of fiscal year 2022. Data for Contractors, Fellows, Trainees, Commissioned Corps, and Advisory Council (including EI and ZZ pay plans) are not included. Not identified race and ethnicity, sex, and disability include missing values. To maintain confidentiality and protect individual identification from deductive disclosure risk, values of less than four are suppressed for reporting purposes and designated with an asterisk. Total calculations shown may not match that derived from detailed data presented due to rounding. Data source: nVision that includes pay period ending 09/30/22; downloaded on 02/14/23.
Click graphic below to open full-size graphic in a new window.
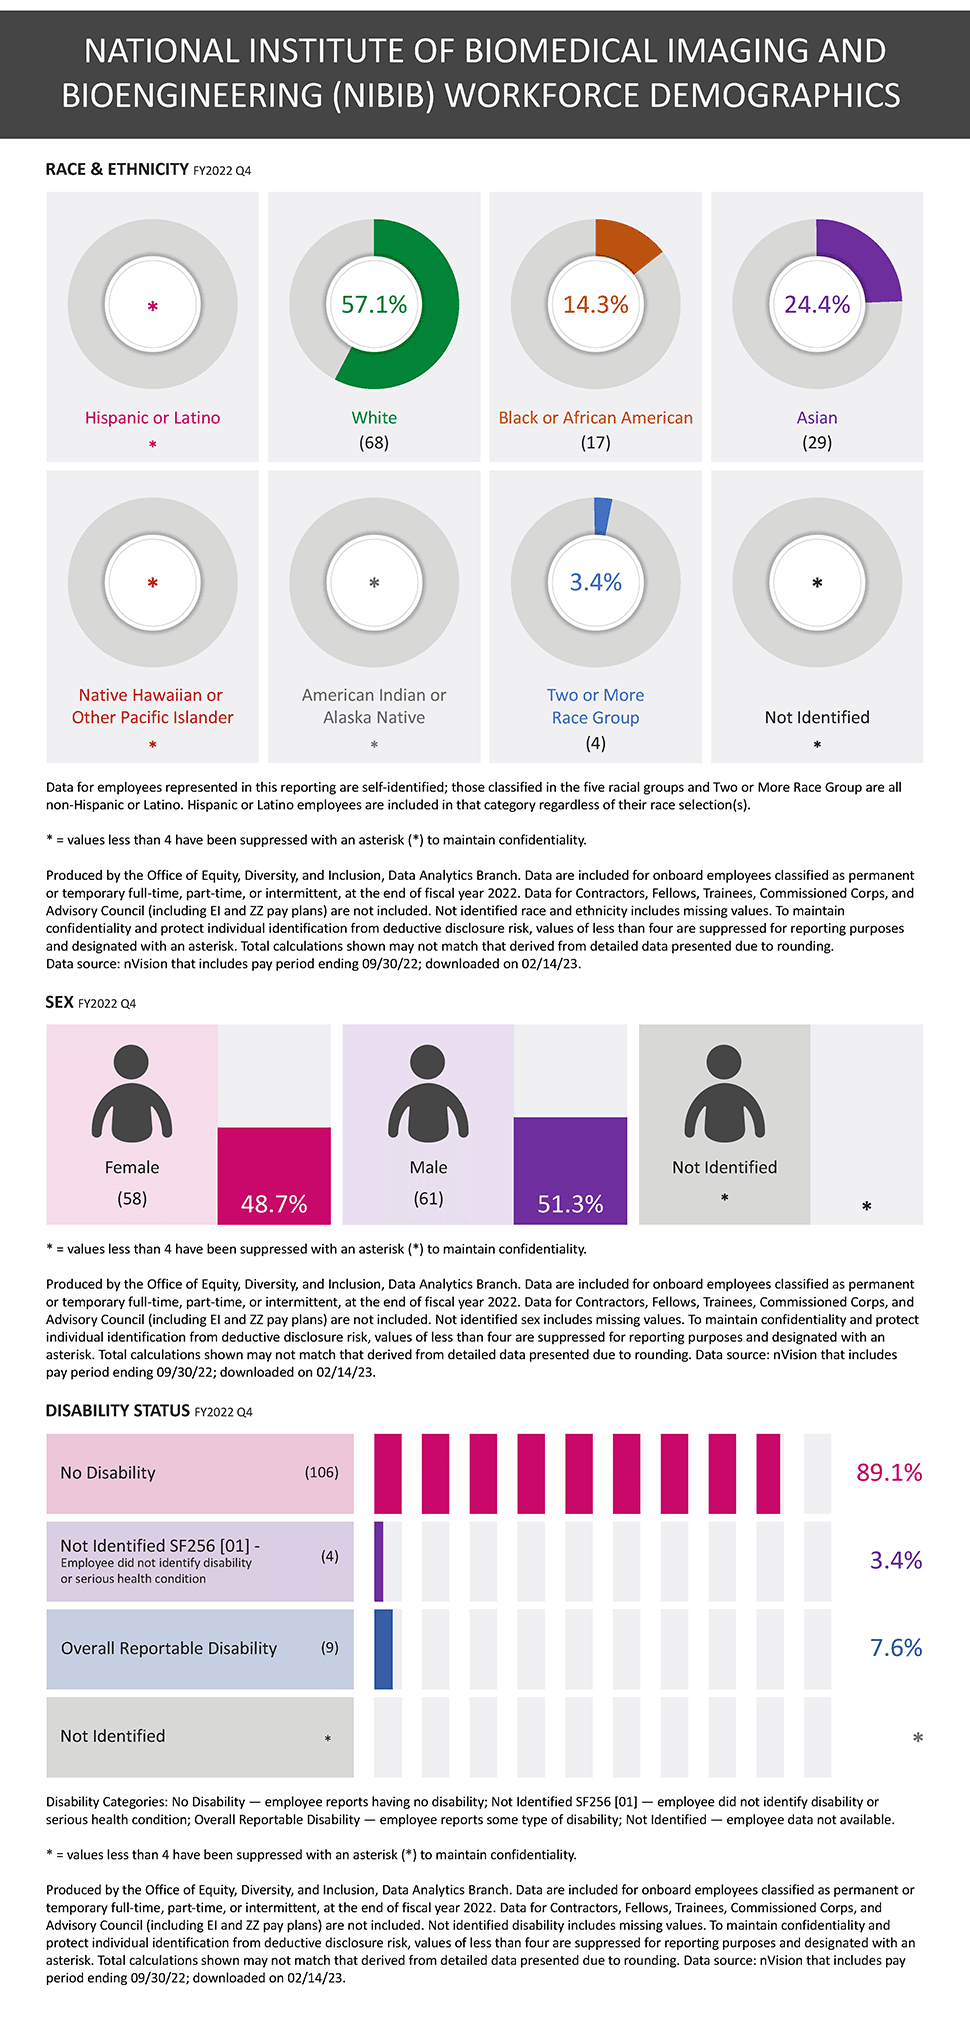
National Institute of Biomedical Imaging and Bioengineering Workforce Demographics
RACE & ETHNICITY: Workforce Demographics by Race and Ethnicity. Graphic showing the proportions of Hispanic or Latino, White, Black or African American, Asian, Native Hawaiian or Other Pacific Islander, American Indian or Alaska Native, Two or More Race Group, and Not Identified NIH employees for Fiscal Year 2022 Fourth Quarter.
RACE & ETHNICITY: Hispanic or Latino = *, *%; White = 68, 57.1%; Black or African American = 17, 14.3%; Asian = 29, 24.4%; Native Hawaiian or Other Pacific Islander = *, *%; American Indian or Alaska Native = *, *%; Two or More Race Group = 4, 3.4%; Not Identified = *, *%
RACE & ETHNICITY: Data for employees represented in this reporting are self-identified; those classified in the five racial groups and Two or More Race Group are all non-Hispanic or Latino. Hispanic or Latino employees are included in that category regardless of their race selection(s).
SEX: Workforce Demographics by Sex. Graphic showing the proportions of Female and Male NIH employees for Fiscal Year 2022 Fourth Quarter.
SEX: FEMALE = 58, 48.7%; MALE = 61, 51.3%; Not Identified = *, *%
DISABILITY: Workforce Demographics by Disability Status. Graphic showing the proportions of NIH employees having disability status as the following: No Disability, Not Identified SF256 [01] – Employee did not identify disability or serious health condition, Overall Reportable Disability, and Not Identified NIH employees for Fiscal Year 2022 Fourth Quarter.
DISABILITY: No Disability = 106, 89.1%; Not Identified SF256 [01] – Employee did not identify disability or serious health condition = 4, 3.4%; Overall Reportable Disability = 9, 7.6%; Not Identified = *, *%
DISABILITY: Disability Categories: No Disability – employee reports having no disability; Not Identified SF256 [01] – employee did not identify disability or serious health condition; Overall Reportable Disability – employee reports some type of disability; Not Identified – employee data not available.
Produced by the Office of Equity, Diversity, and Inclusion, Data Analytics Branch. Data are included for onboard employees classified as permanent or temporary full-time, part-time, or intermittent, at the end of fiscal year 2022. Data for Contractors, Fellows, Trainees, Commissioned Corps, and Advisory Council (including EI and ZZ pay plans) are not included. Not identified race and ethnicity, sex, and disability include missing values. To maintain confidentiality and protect individual identification from deductive disclosure risk, values of less than four are suppressed for reporting purposes and designated with an asterisk. Total calculations shown may not match that derived from detailed data presented due to rounding. Data source: nVision that includes pay period ending 09/30/22; downloaded on 02/14/23.
Click graphic below to open full-size graphic in a new window.
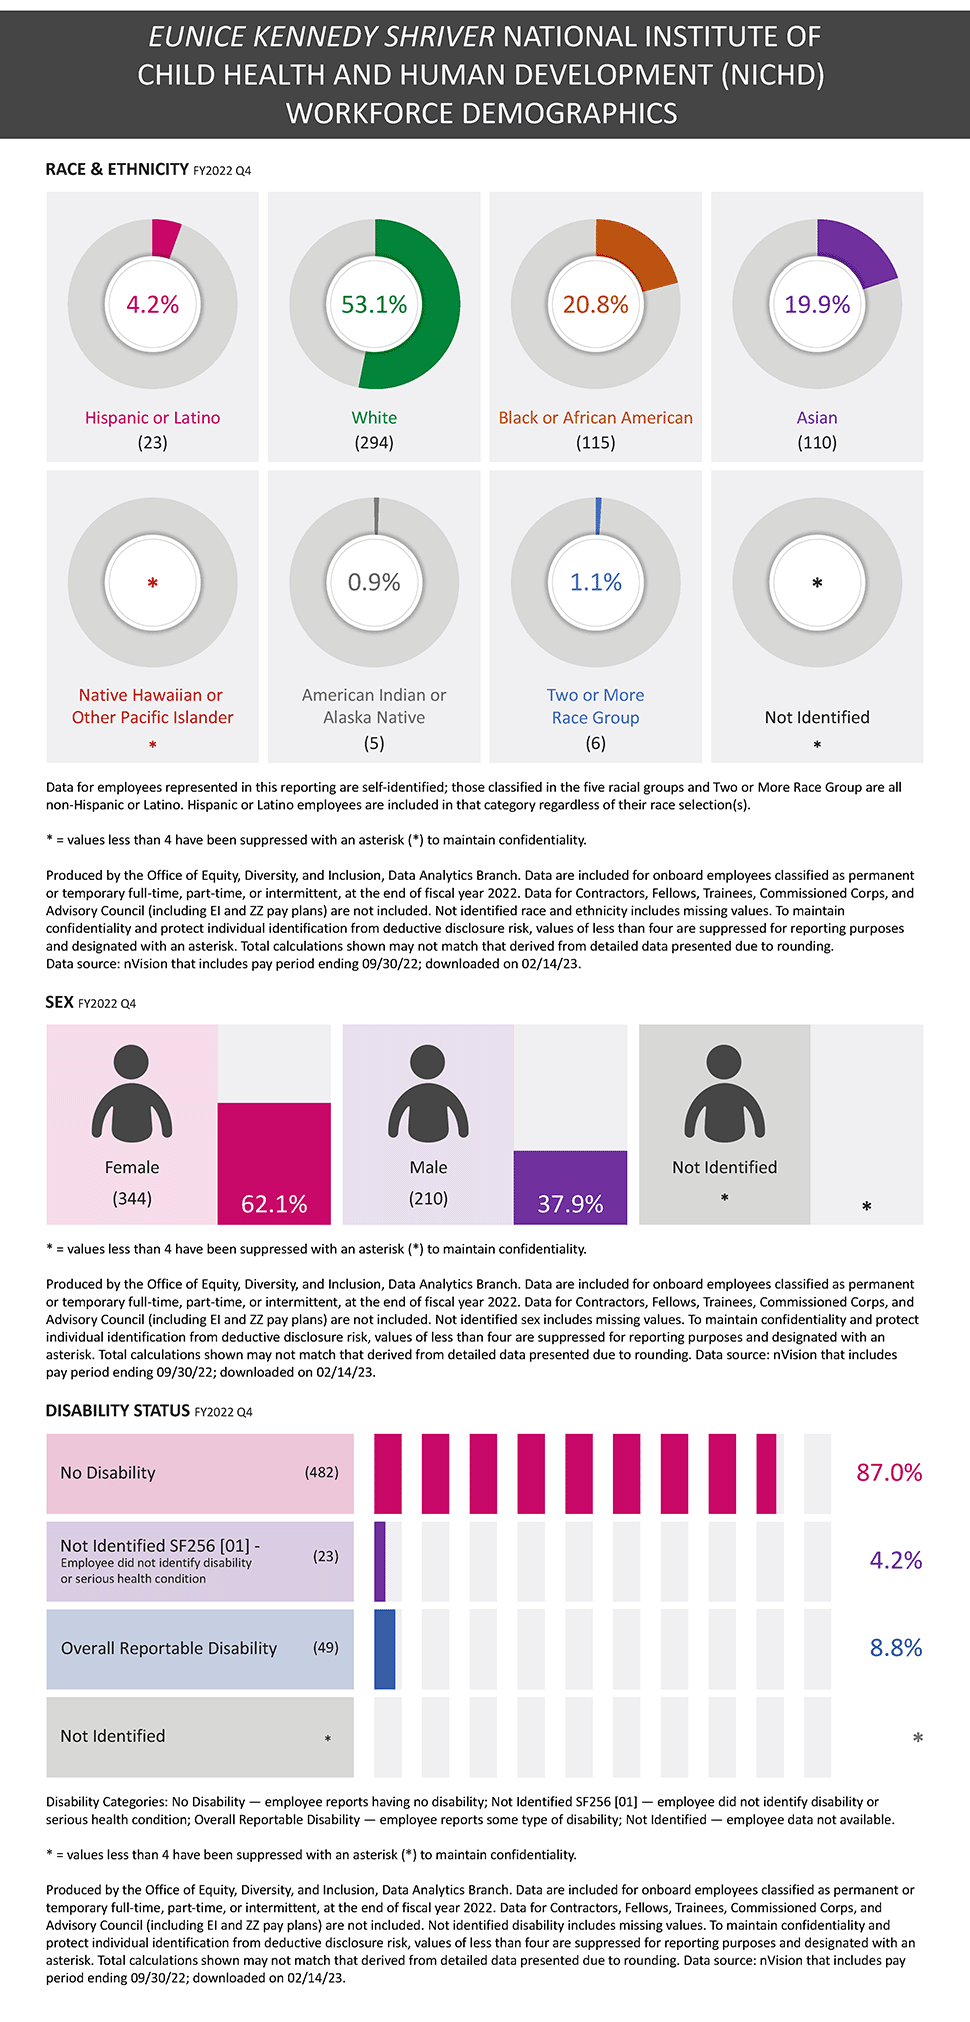
Eunice Kennedy Shriver National Institute of Child Health and Human Development Workforce Demographics
RACE & ETHNICITY: Workforce Demographics by Race and Ethnicity. Graphic showing the proportions of Hispanic or Latino, White, Black or African American, Asian, Native Hawaiian or Other Pacific Islander, American Indian or Alaska Native, Two or More Race Group, and Not Identified NIH employees for Fiscal Year 2022 Fourth Quarter.
RACE & ETHNICITY: Hispanic or Latino = 23, 4.2%; White = 294, 53.1%; Black or African American = 115, 20.8%; Asian = 110, 19.9%; Native Hawaiian or Other Pacific Islander = *, *%; American Indian or Alaska Native = 5, 0.9%; Two or More Race Group = 6, 1.1%; Not Identified = *, *%
RACE & ETHNICITY: Data for employees represented in this reporting are self-identified; those classified in the five racial groups and Two or More Race Group are all non-Hispanic or Latino. Hispanic or Latino employees are included in that category regardless of their race selection(s).
SEX: Workforce Demographics by Sex. Graphic showing the proportions of Female and Male NIH employees for Fiscal Year 2022 Fourth Quarter.
SEX: FEMALE = 344, 62.1%; MALE = 210, 37.9%; Not Identified = *, *%
DISABILITY: Workforce Demographics by Disability Status. Graphic showing the proportions of NIH employees having disability status as the following: No Disability, Not Identified SF256 [01] – Employee did not identify disability or serious health condition, Overall Reportable Disability, and Not Identified NIH employees for Fiscal Year 2022 Fourth Quarter.
DISABILITY: No Disability = 482, 87.0%; Not Identified SF256 [01] – Employee did not identify disability or serious health condition = 23, 4.2%; Overall Reportable Disability = 49, 8.8%; Not Identified = *, *%
DISABILITY: Disability Categories: No Disability – employee reports having no disability; Not Identified SF256 [01] – employee did not identify disability or serious health condition; Overall Reportable Disability – employee reports some type of disability; Not Identified – employee data not available.
Produced by the Office of Equity, Diversity, and Inclusion, Data Analytics Branch. Data are included for onboard employees classified as permanent or temporary full-time, part-time, or intermittent, at the end of fiscal year 2022. Data for Contractors, Fellows, Trainees, Commissioned Corps, and Advisory Council (including EI and ZZ pay plans) are not included. Not identified race and ethnicity, sex, and disability include missing values. To maintain confidentiality and protect individual identification from deductive disclosure risk, values of less than four are suppressed for reporting purposes and designated with an asterisk. Total calculations shown may not match that derived from detailed data presented due to rounding. Data source: nVision that includes pay period ending 09/30/22; downloaded on 02/14/23.
Click graphic below to open full-size graphic in a new window.
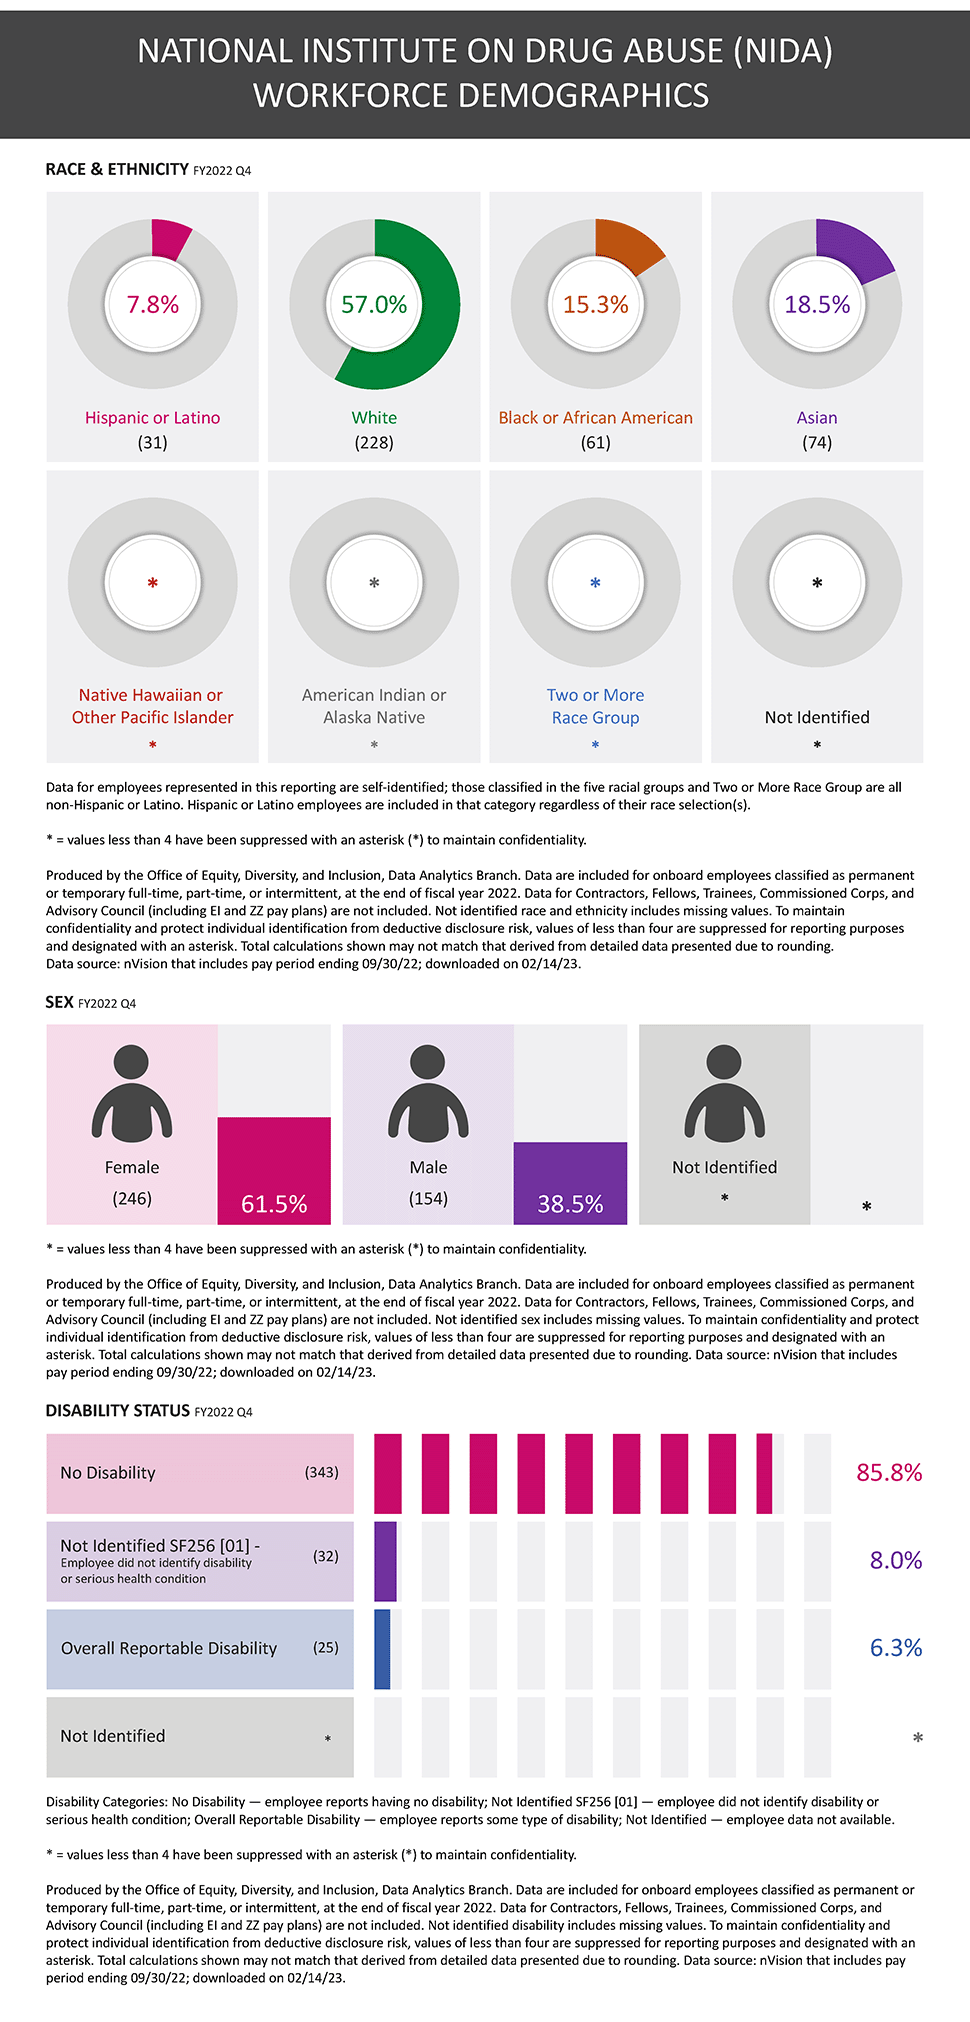
National Institute on Drug Abuse Workforce Demographics
RACE & ETHNICITY: Workforce Demographics by Race and Ethnicity. Graphic showing the proportions of Hispanic or Latino, White, Black or African American, Asian, Native Hawaiian or Other Pacific Islander, American Indian or Alaska Native, Two or More Race Group, and Not Identified NIH employees for Fiscal Year 2022 Fourth Quarter.
RACE & ETHNICITY: Hispanic or Latino = 31, 7.8%; White = 228, 57.0%; Black or African American = 61, 15.3%; Asian = 74, 18.5%; Native Hawaiian or Other Pacific Islander = *, *%; American Indian or Alaska Native = *, *%; Two or More Race Group = *, *%; Not Identified = *, *%
RACE & ETHNICITY: Data for employees represented in this reporting are self-identified; those classified in the five racial groups and Two or More Race Group are all non-Hispanic or Latino. Hispanic or Latino employees are included in that category regardless of their race selection(s).
SEX: Workforce Demographics by Sex. Graphic showing the proportions of Female and Male NIH employees for Fiscal Year 2022 Fourth Quarter.
SEX: FEMALE = 246, 61.5%; MALE = 154, 38.5%; Not Identified = *, *%
DISABILITY: Workforce Demographics by Disability Status. Graphic showing the proportions of NIH employees having disability status as the following: No Disability, Not Identified SF256 [01] – Employee did not identify disability or serious health condition, Overall Reportable Disability, and Not Identified NIH employees for Fiscal Year 2022 Fourth Quarter.
DISABILITY: No Disability = 343, 85.8%; Not Identified SF256 [01] – Employee did not identify disability or serious health condition = 32, 8.0%; Overall Reportable Disability = 25, 6.3%; Not Identified = *, *%
DISABILITY: Disability Categories: No Disability – employee reports having no disability; Not Identified SF256 [01] – employee did not identify disability or serious health condition; Overall Reportable Disability – employee reports some type of disability; Not Identified – employee data not available.
Produced by the Office of Equity, Diversity, and Inclusion, Data Analytics Branch. Data are included for onboard employees classified as permanent or temporary full-time, part-time, or intermittent, at the end of fiscal year 2022. Data for Contractors, Fellows, Trainees, Commissioned Corps, and Advisory Council (including EI and ZZ pay plans) are not included. Not identified race and ethnicity, sex, and disability include missing values. To maintain confidentiality and protect individual identification from deductive disclosure risk, values of less than four are suppressed for reporting purposes and designated with an asterisk. Total calculations shown may not match that derived from detailed data presented due to rounding. Data source: nVision that includes pay period ending 09/30/22; downloaded on 02/14/23.
Click graphic below to open full-size graphic in a new window.
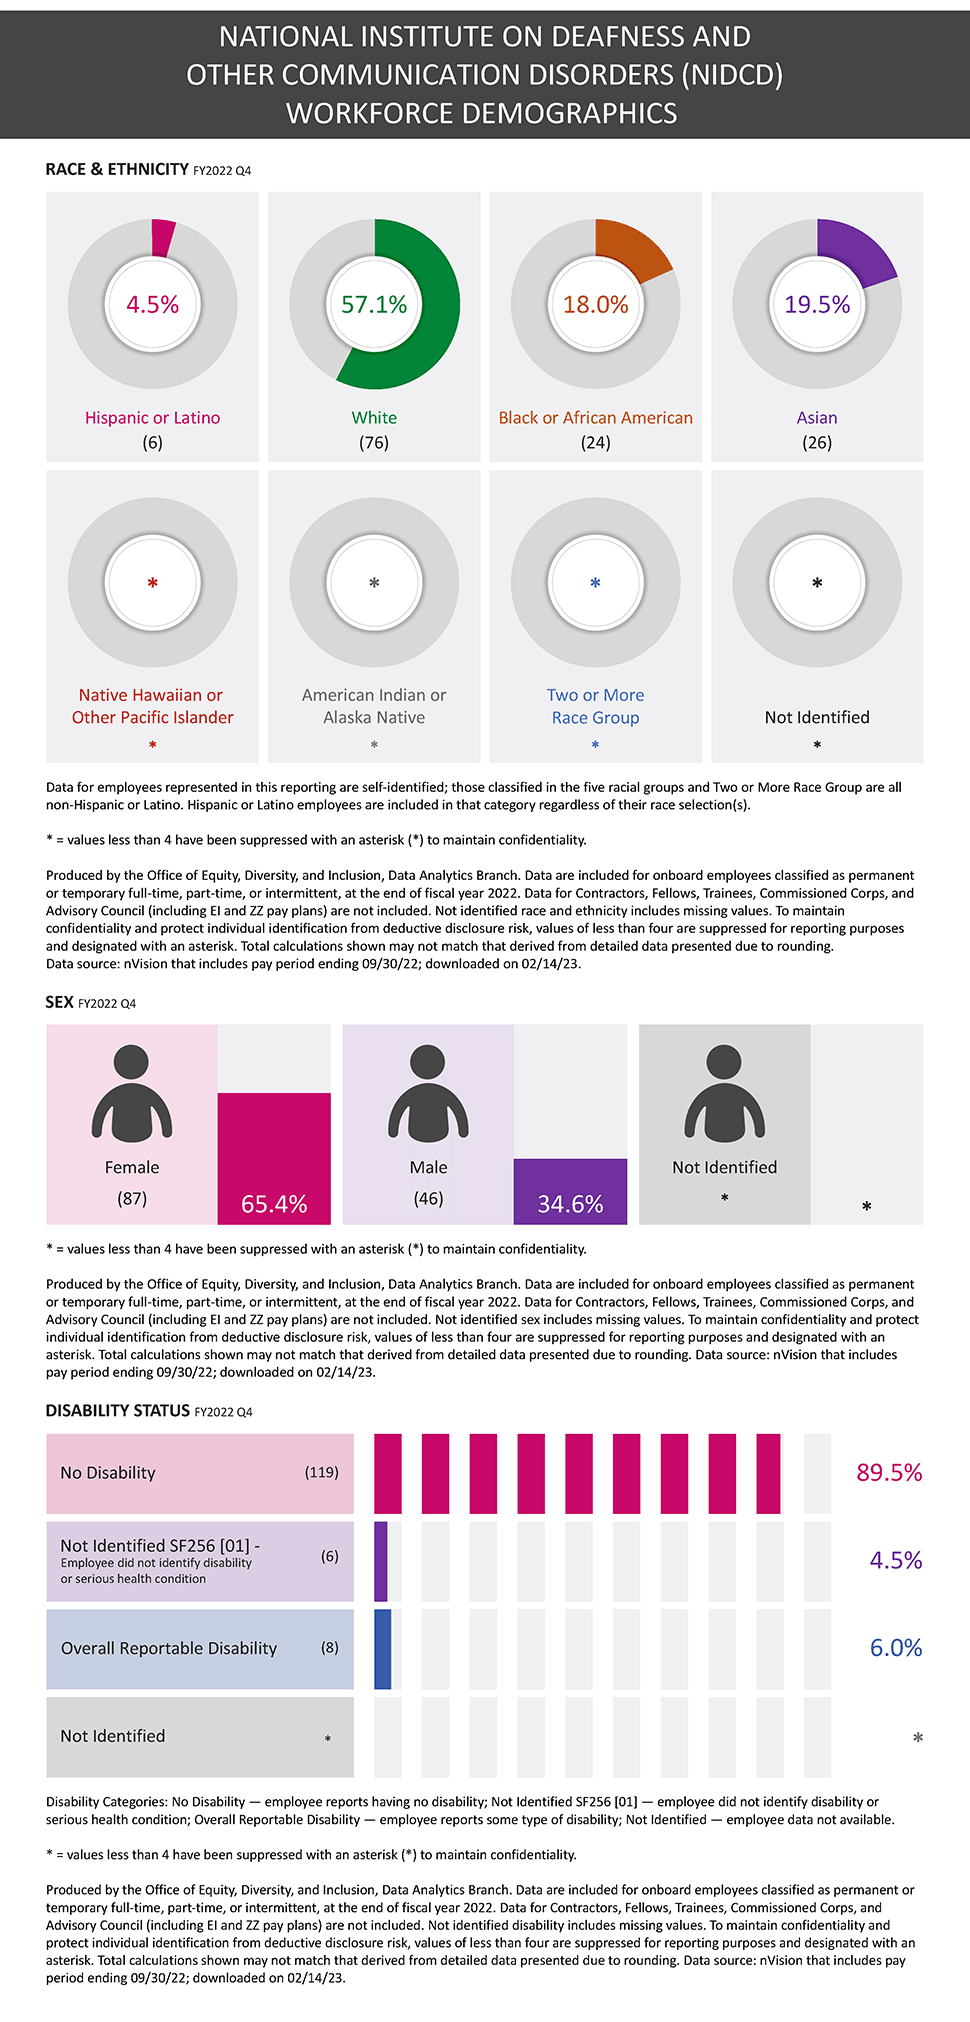
National Institute on Deafness and Other Communication Disorders Workforce Demographics
RACE & ETHNICITY: Workforce Demographics by Race and Ethnicity. Graphic showing the proportions of Hispanic or Latino, White, Black or African American, Asian, Native Hawaiian or Other Pacific Islander, American Indian or Alaska Native, Two or More Race Group, and Not Identified NIH employees for Fiscal Year 2022 Fourth Quarter.
RACE & ETHNICITY: Hispanic or Latino = 6, 4.5%; White = 76, 57.1%; Black or African American = 24, 18.0%; Asian = 26, 19.5%; Native Hawaiian or Other Pacific Islander = *, *%; American Indian or Alaska Native = *, *%; Two or More Race Group = *, *%; Not Identified = *, *%
RACE & ETHNICITY: Data for employees represented in this reporting are self-identified; those classified in the five racial groups and Two or More Race Group are all non-Hispanic or Latino. Hispanic or Latino employees are included in that category regardless of their race selection(s).
SEX: Workforce Demographics by Sex. Graphic showing the proportions of Female and Male NIH employees for Fiscal Year 2022 Fourth Quarter.
SEX: FEMALE = 87, 65.4%; MALE = 46, 34.6%; Not Identified = *, *%
DISABILITY: Workforce Demographics by Disability Status. Graphic showing the proportions of NIH employees having disability status as the following: No Disability, Not Identified SF256 [01] – Employee did not identify disability or serious health condition, Overall Reportable Disability, and Not Identified NIH employees for Fiscal Year 2022 Fourth Quarter.
DISABILITY: No Disability = 119, 89.5%; Not Identified SF256 [01] – Employee did not identify disability or serious health condition = 6, 4.5%; Overall Reportable Disability = 8, 6.0%; Not Identified = *, *%
DISABILITY: Disability Categories: No Disability – employee reports having no disability; Not Identified SF256 [01] – employee did not identify disability or serious health condition; Overall Reportable Disability – employee reports some type of disability; Not Identified – employee data not available.
Produced by the Office of Equity, Diversity, and Inclusion, Data Analytics Branch. Data are included for onboard employees classified as permanent or temporary full-time, part-time, or intermittent, at the end of fiscal year 2022. Data for Contractors, Fellows, Trainees, Commissioned Corps, and Advisory Council (including EI and ZZ pay plans) are not included. Not identified race and ethnicity, sex, and disability include missing values. To maintain confidentiality and protect individual identification from deductive disclosure risk, values of less than four are suppressed for reporting purposes and designated with an asterisk. Total calculations shown may not match that derived from detailed data presented due to rounding. Data source: nVision that includes pay period ending 09/30/22; downloaded on 02/14/23.
Click graphic below to open full-size graphic in a new window.
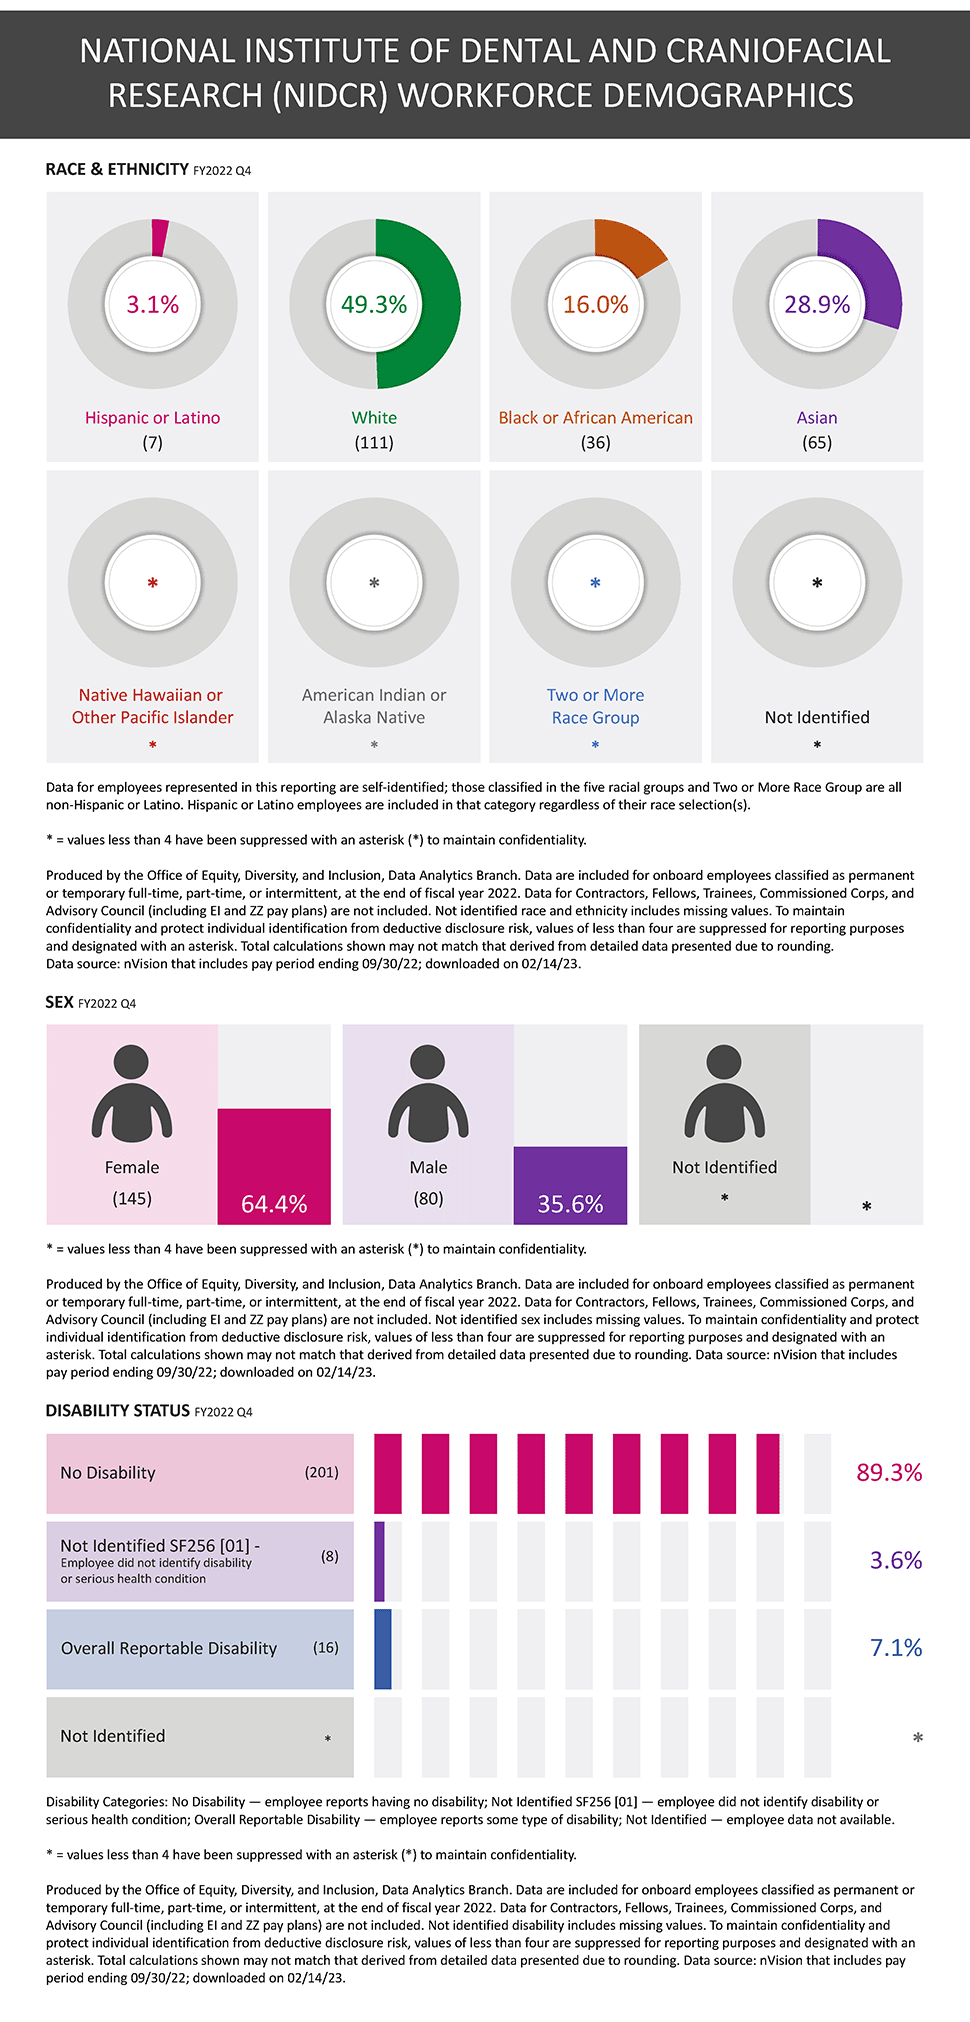
National Institute of Dental and Craniofacial Research Workforce Demographics
RACE & ETHNICITY: Workforce Demographics by Race and Ethnicity. Graphic showing the proportions of Hispanic or Latino, White, Black or African American, Asian, Native Hawaiian or Other Pacific Islander, American Indian or Alaska Native, Two or More Race Group, and Not Identified NIH employees for Fiscal Year 2022 Fourth Quarter.
RACE & ETHNICITY: Hispanic or Latino = 7, 3.1%; White = 111, 49.3%; Black or African American = 36, 16.0%; Asian = 65, 28.9%; Native Hawaiian or Other Pacific Islander = *, *%; American Indian or Alaska Native = *, *%; Two or More Race Group = *, *%; Not Identified = *, *%
RACE & ETHNICITY: Data for employees represented in this reporting are self-identified; those classified in the five racial groups and Two or More Race Group are all non-Hispanic or Latino. Hispanic or Latino employees are included in that category regardless of their race selection(s).
SEX: Workforce Demographics by Sex. Graphic showing the proportions of Female and Male NIH employees for Fiscal Year 2022 Fourth Quarter.
SEX: FEMALE = 145, 64.4%; MALE = 80, 35.6%; Not Identified = *, *%
DISABILITY: Workforce Demographics by Disability Status. Graphic showing the proportions of NIH employees having disability status as the following: No Disability, Not Identified SF256 [01] – Employee did not identify disability or serious health condition, Overall Reportable Disability, and Not Identified NIH employees for Fiscal Year 2022 Fourth Quarter.
DISABILITY: No Disability = 201, 89.3%; Not Identified SF256 [01] – Employee did not identify disability or serious health condition = 8, 3.6%; Overall Reportable Disability = 16, 7.1%; Not Identified = *, *%
DISABILITY: Disability Categories: No Disability – employee reports having no disability; Not Identified SF256 [01] – employee did not identify disability or serious health condition; Overall Reportable Disability – employee reports some type of disability; Not Identified – employee data not available.
Produced by the Office of Equity, Diversity, and Inclusion, Data Analytics Branch. Data are included for onboard employees classified as permanent or temporary full-time, part-time, or intermittent, at the end of fiscal year 2022. Data for Contractors, Fellows, Trainees, Commissioned Corps, and Advisory Council (including EI and ZZ pay plans) are not included. Not identified race and ethnicity, sex, and disability include missing values. To maintain confidentiality and protect individual identification from deductive disclosure risk, values of less than four are suppressed for reporting purposes and designated with an asterisk. Total calculations shown may not match that derived from detailed data presented due to rounding. Data source: nVision that includes pay period ending 09/30/22; downloaded on 02/14/23.
Click graphic below to open full-size graphic in a new window.
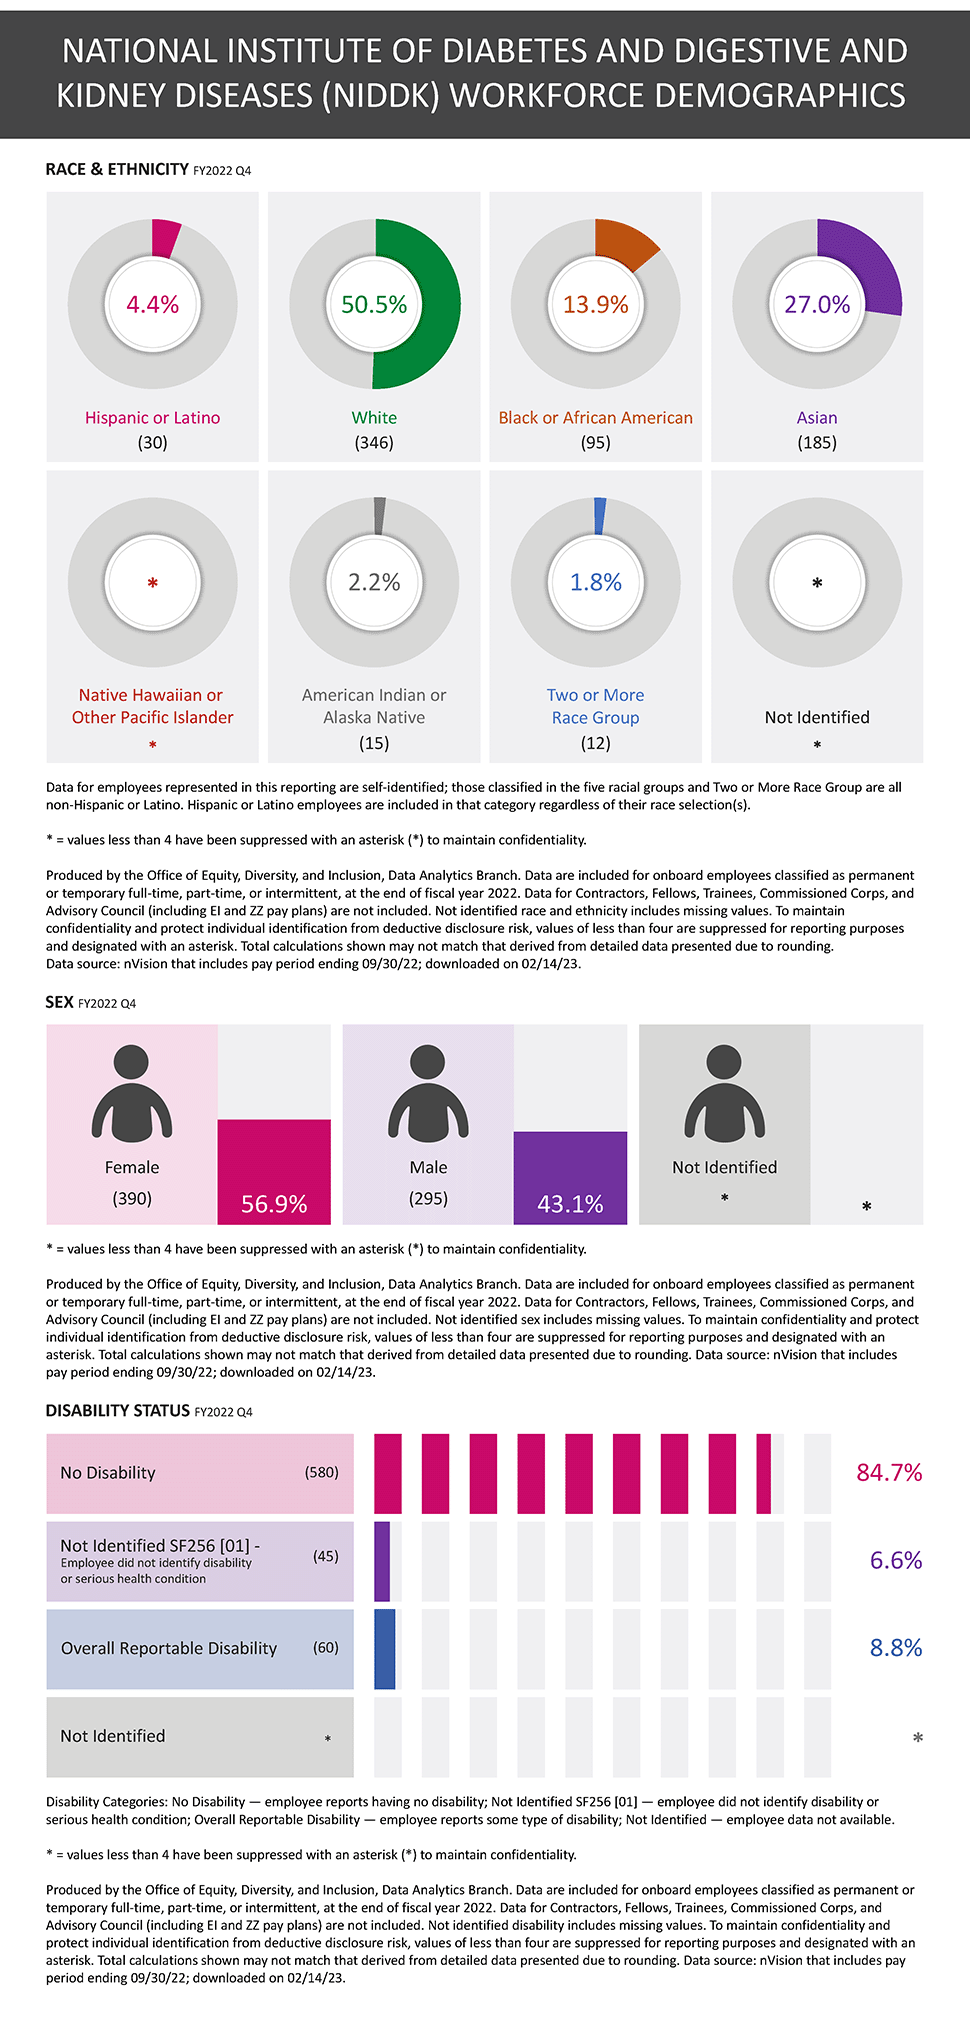
National Institute of Diabetes and Digestive and Kidney Diseases Workforce Demographics
RACE & ETHNICITY: Workforce Demographics by Race and Ethnicity. Graphic showing the proportions of Hispanic or Latino, White, Black or African American, Asian, Native Hawaiian or Other Pacific Islander, American Indian or Alaska Native, Two or More Race Group, and Not Identified NIH employees for Fiscal Year 2022 Fourth Quarter.
RACE & ETHNICITY: Hispanic or Latino = 30, 4.4%; White = 346, 50.5%; Black or African American = 95, 13.9%; Asian = 185, 27.0%; Native Hawaiian or Other Pacific Islander = *, *%; American Indian or Alaska Native = 15, 2.2%; Two or More Race Group = 12, 1.8%; Not Identified = *, *%
RACE & ETHNICITY: Data for employees represented in this reporting are self-identified; those classified in the five racial groups and Two or More Race Group are all non-Hispanic or Latino. Hispanic or Latino employees are included in that category regardless of their race selection(s).
SEX: Workforce Demographics by Sex. Graphic showing the proportions of Female and Male NIH employees for Fiscal Year 2022 Fourth Quarter.
SEX: FEMALE = 390, 56.9%; MALE = 295, 43.1%; Not Identified = *, *%
DISABILITY: Workforce Demographics by Disability Status. Graphic showing the proportions of NIH employees having disability status as the following: No Disability, Not Identified SF256 [01] – Employee did not identify disability or serious health condition, Overall Reportable Disability, and Not Identified NIH employees for Fiscal Year 2022 Fourth Quarter.
DISABILITY: No Disability = 580, 84.7%; Not Identified SF256 [01] – Employee did not identify disability or serious health condition = 45, 6.6%; Overall Reportable Disability = 60, 8.8%; Not Identified = *, *%
DISABILITY: Disability Categories: No Disability – employee reports having no disability; Not Identified SF256 [01] – employee did not identify disability or serious health condition; Overall Reportable Disability – employee reports some type of disability; Not Identified – employee data not available.
Produced by the Office of Equity, Diversity, and Inclusion, Data Analytics Branch. Data are included for onboard employees classified as permanent or temporary full-time, part-time, or intermittent, at the end of fiscal year 2022. Data for Contractors, Fellows, Trainees, Commissioned Corps, and Advisory Council (including EI and ZZ pay plans) are not included. Not identified race and ethnicity, sex, and disability include missing values. To maintain confidentiality and protect individual identification from deductive disclosure risk, values of less than four are suppressed for reporting purposes and designated with an asterisk. Total calculations shown may not match that derived from detailed data presented due to rounding. Data source: nVision that includes pay period ending 09/30/22; downloaded on 02/14/23.
Click graphic below to open full-size graphic in a new window.
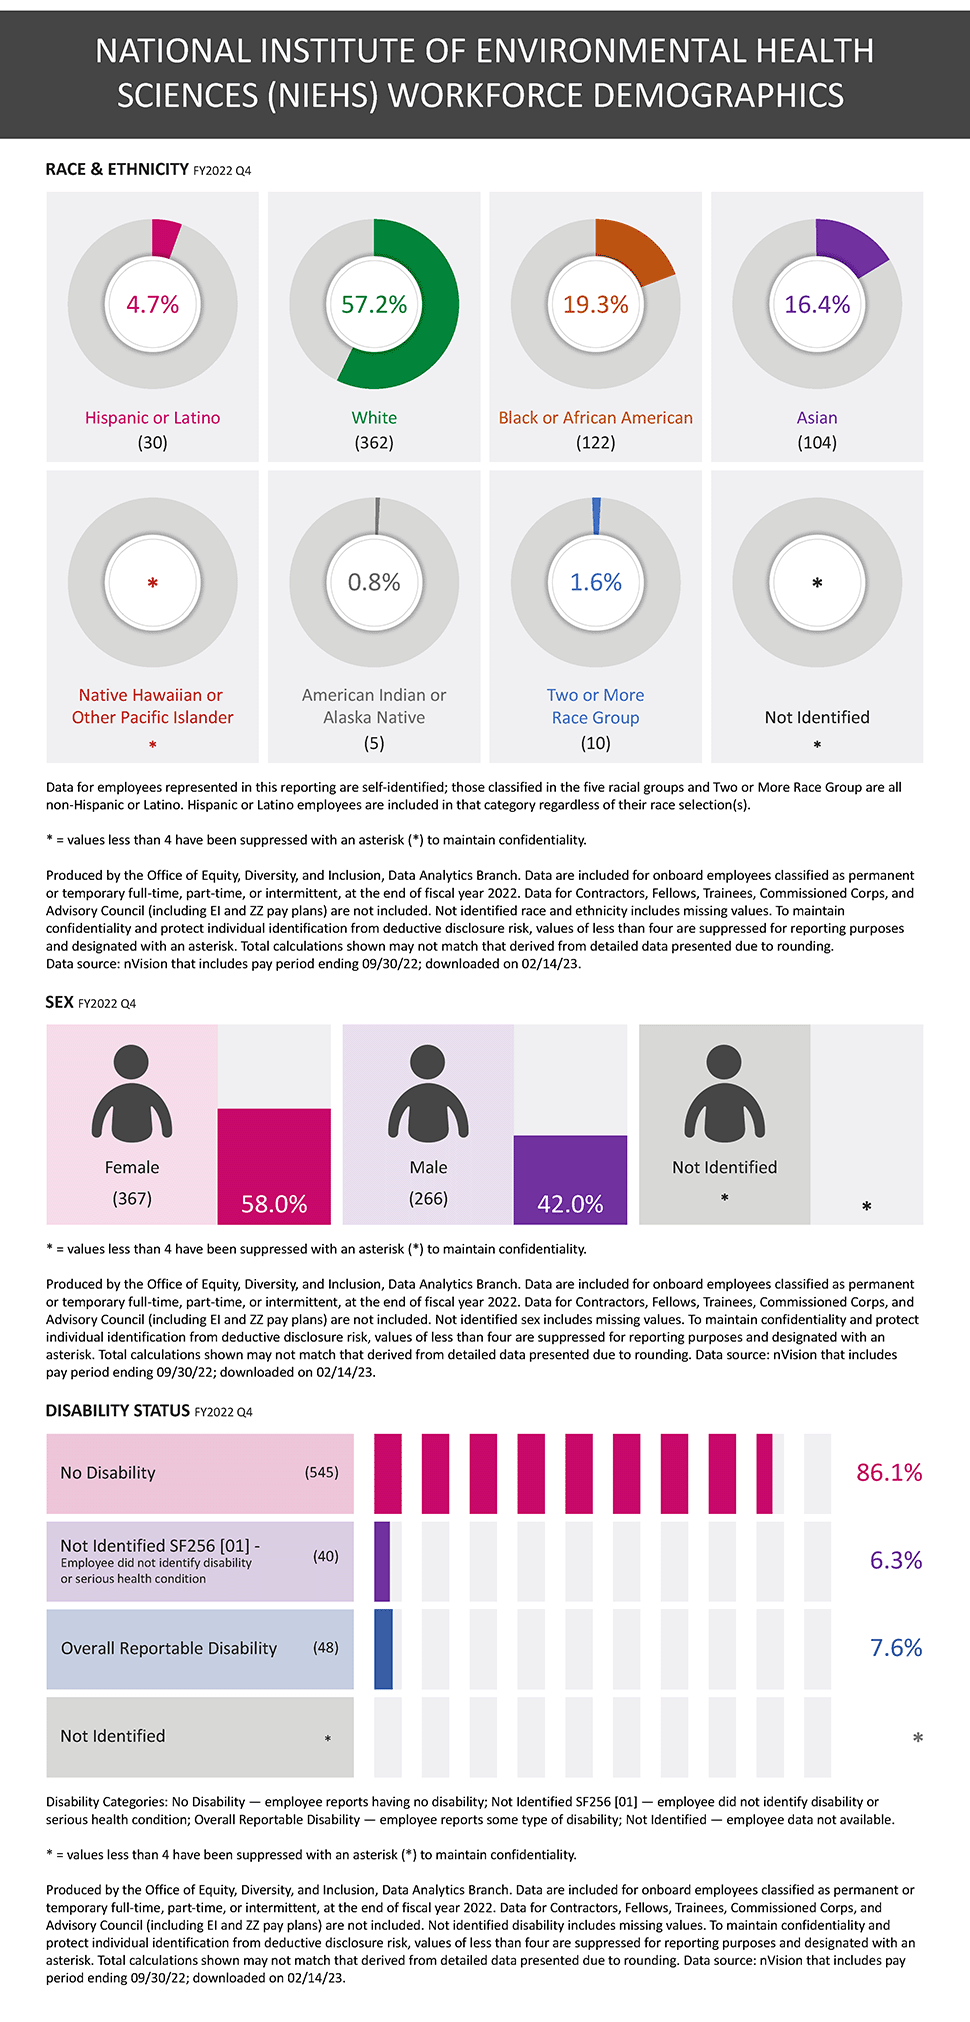
National Institute of Environmental Health Sciences Workforce Demographics
RACE & ETHNICITY: Workforce Demographics by Race and Ethnicity. Graphic showing the proportions of Hispanic or Latino, White, Black or African American, Asian, Native Hawaiian or Other Pacific Islander, American Indian or Alaska Native, Two or More Race Group, and Not Identified NIH employees for Fiscal Year 2022 Fourth Quarter.
RACE & ETHNICITY: Hispanic or Latino = 30, 4.7%; White = 362, 57.2%; Black or African American = 122, 19.3%; Asian = 104, 16.4%; Native Hawaiian or Other Pacific Islander = *, *%; American Indian or Alaska Native = 5, 0.8%; Two or More Race Group = 10, 1.6%; Not Identified = *, *%
RACE & ETHNICITY: Data for employees represented in this reporting are self-identified; those classified in the five racial groups and Two or More Race Group are all non-Hispanic or Latino. Hispanic or Latino employees are included in that category regardless of their race selection(s).
SEX: Workforce Demographics by Sex. Graphic showing the proportions of Female and Male NIH employees for Fiscal Year 2022 Fourth Quarter.
SEX: FEMALE = 367, 58.0%; MALE = 266, 42.0%; Not Identified = *, *%
DISABILITY: Workforce Demographics by Disability Status. Graphic showing the proportions of NIH employees having disability status as the following: No Disability, Not Identified SF256 [01] – Employee did not identify disability or serious health condition, Overall Reportable Disability, and Not Identified NIH employees for Fiscal Year 2022 Fourth Quarter.
DISABILITY: No Disability = 545, 86.1%; Not Identified SF256 [01] – Employee did not identify disability or serious health condition = 40, 6.3%; Overall Reportable Disability = 48, 7.6%; Not Identified = *, *%
DISABILITY: Disability Categories: No Disability – employee reports having no disability; Not Identified SF256 [01] – employee did not identify disability or serious health condition; Overall Reportable Disability – employee reports some type of disability; Not Identified – employee data not available.
Produced by the Office of Equity, Diversity, and Inclusion, Data Analytics Branch. Data are included for onboard employees classified as permanent or temporary full-time, part-time, or intermittent, at the end of fiscal year 2022. Data for Contractors, Fellows, Trainees, Commissioned Corps, and Advisory Council (including EI and ZZ pay plans) are not included. Not identified race and ethnicity, sex, and disability include missing values. To maintain confidentiality and protect individual identification from deductive disclosure risk, values of less than four are suppressed for reporting purposes and designated with an asterisk. Total calculations shown may not match that derived from detailed data presented due to rounding. Data source: nVision that includes pay period ending 09/30/22; downloaded on 02/14/23.
Click graphic below to open full-size graphic in a new window.
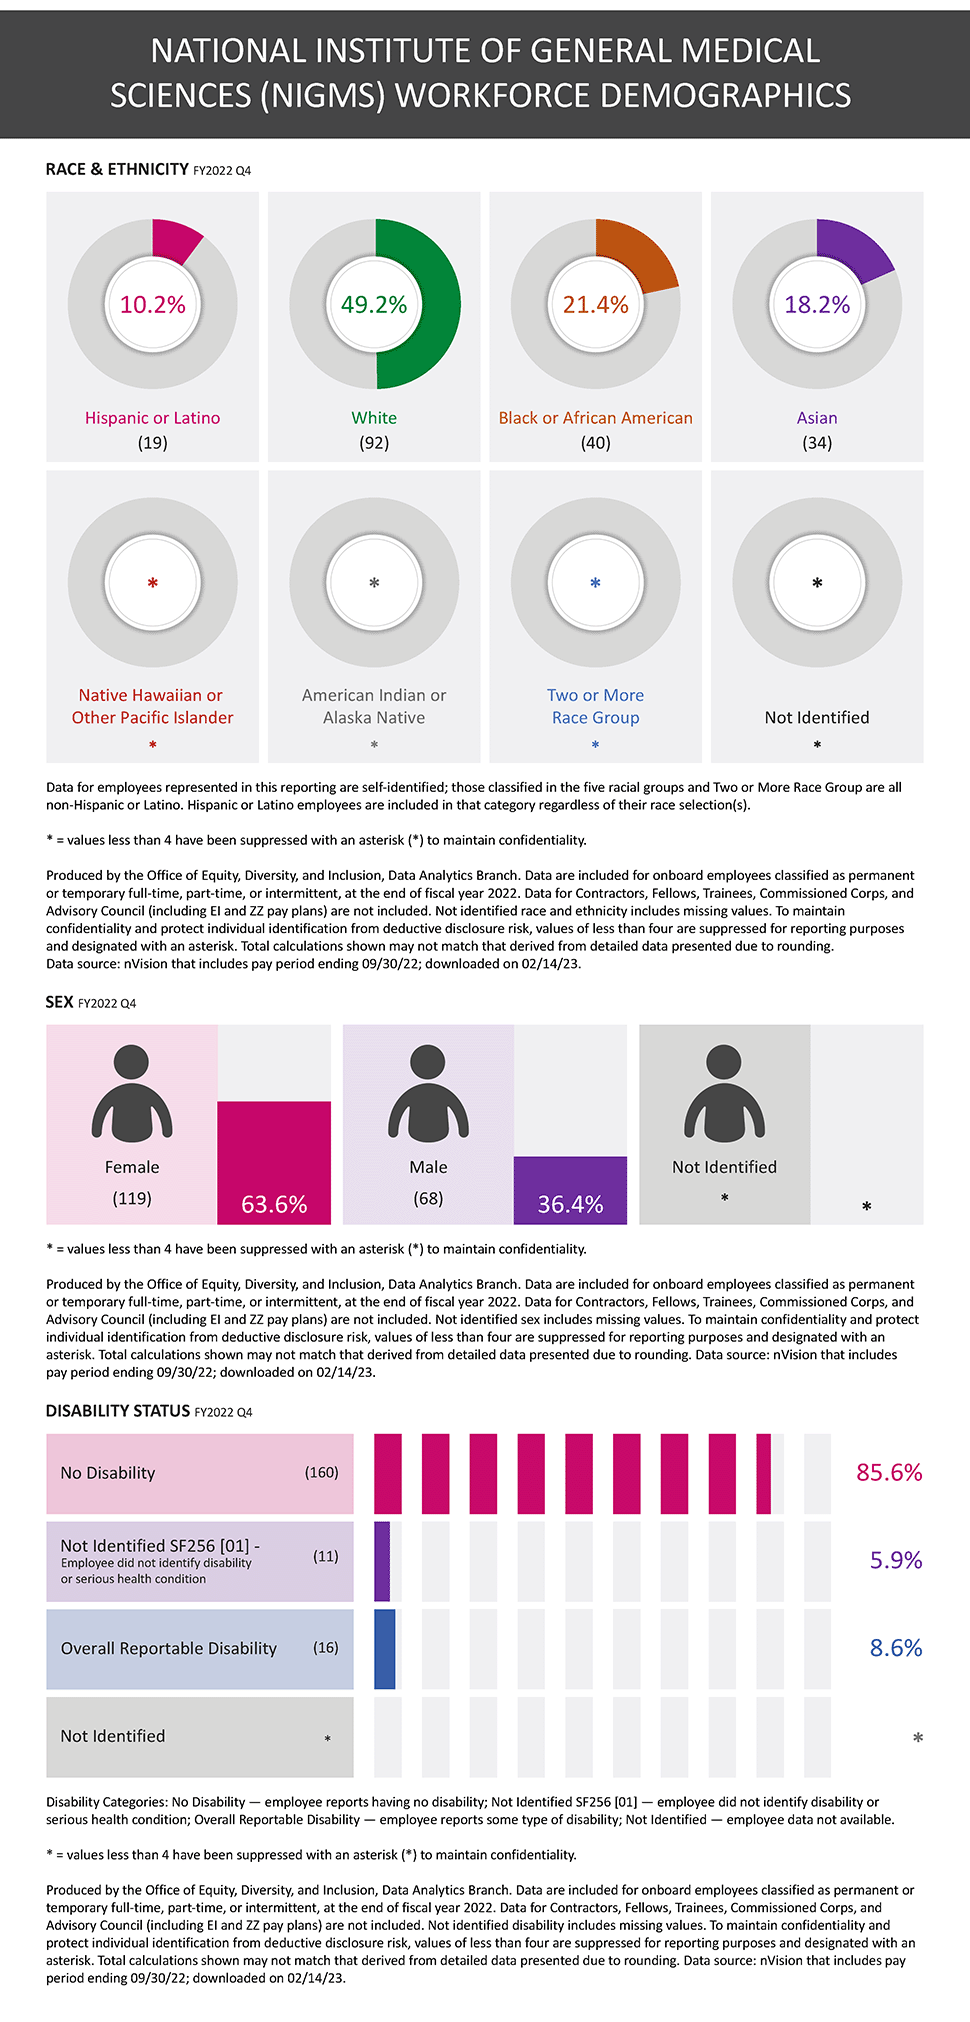
National Institute of General Medical Sciences Workforce Demographics
RACE & ETHNICITY: Workforce Demographics by Race and Ethnicity. Graphic showing the proportions of Hispanic or Latino, White, Black or African American, Asian, Native Hawaiian or Other Pacific Islander, American Indian or Alaska Native, Two or More Race Group, and Not Identified NIH employees for Fiscal Year 2022 Fourth Quarter.
RACE & ETHNICITY: Hispanic or Latino = 19, 10.2%; White = 92, 49.2%; Black or African American = 40, 21.4%; Asian = 34, 18.2%; Native Hawaiian or Other Pacific Islander = *, *%; American Indian or Alaska Native = *, *%; Two or More Race Group = *, *%; Not Identified = *, *%
RACE & ETHNICITY: Data for employees represented in this reporting are self-identified; those classified in the five racial groups and Two or More Race Group are all non-Hispanic or Latino. Hispanic or Latino employees are included in that category regardless of their race selection(s).
SEX: Workforce Demographics by Sex. Graphic showing the proportions of Female and Male NIH employees for Fiscal Year 2022 Fourth Quarter.
SEX: FEMALE = 119, 63.6%; MALE = 68, 36.4%; Not Identified = *, *%
DISABILITY: Workforce Demographics by Disability Status. Graphic showing the proportions of NIH employees having disability status as the following: No Disability, Not Identified SF256 [01] – Employee did not identify disability or serious health condition, Overall Reportable Disability, and Not Identified NIH employees for Fiscal Year 2022 Fourth Quarter.
DISABILITY: No Disability = 160, 85.6%; Not Identified SF256 [01] – Employee did not identify disability or serious health condition = 11, 5.9%; Overall Reportable Disability = 16, 8.6%; Not Identified = *, *%
DISABILITY: Disability Categories: No Disability – employee reports having no disability; Not Identified SF256 [01] – employee did not identify disability or serious health condition; Overall Reportable Disability – employee reports some type of disability; Not Identified – employee data not available.
Produced by the Office of Equity, Diversity, and Inclusion, Data Analytics Branch. Data are included for onboard employees classified as permanent or temporary full-time, part-time, or intermittent, at the end of fiscal year 2022. Data for Contractors, Fellows, Trainees, Commissioned Corps, and Advisory Council (including EI and ZZ pay plans) are not included. Not identified race and ethnicity, sex, and disability include missing values. To maintain confidentiality and protect individual identification from deductive disclosure risk, values of less than four are suppressed for reporting purposes and designated with an asterisk. Total calculations shown may not match that derived from detailed data presented due to rounding. Data source: nVision that includes pay period ending 09/30/22; downloaded on 02/14/23.
Click graphic below to open full-size graphic in a new window.
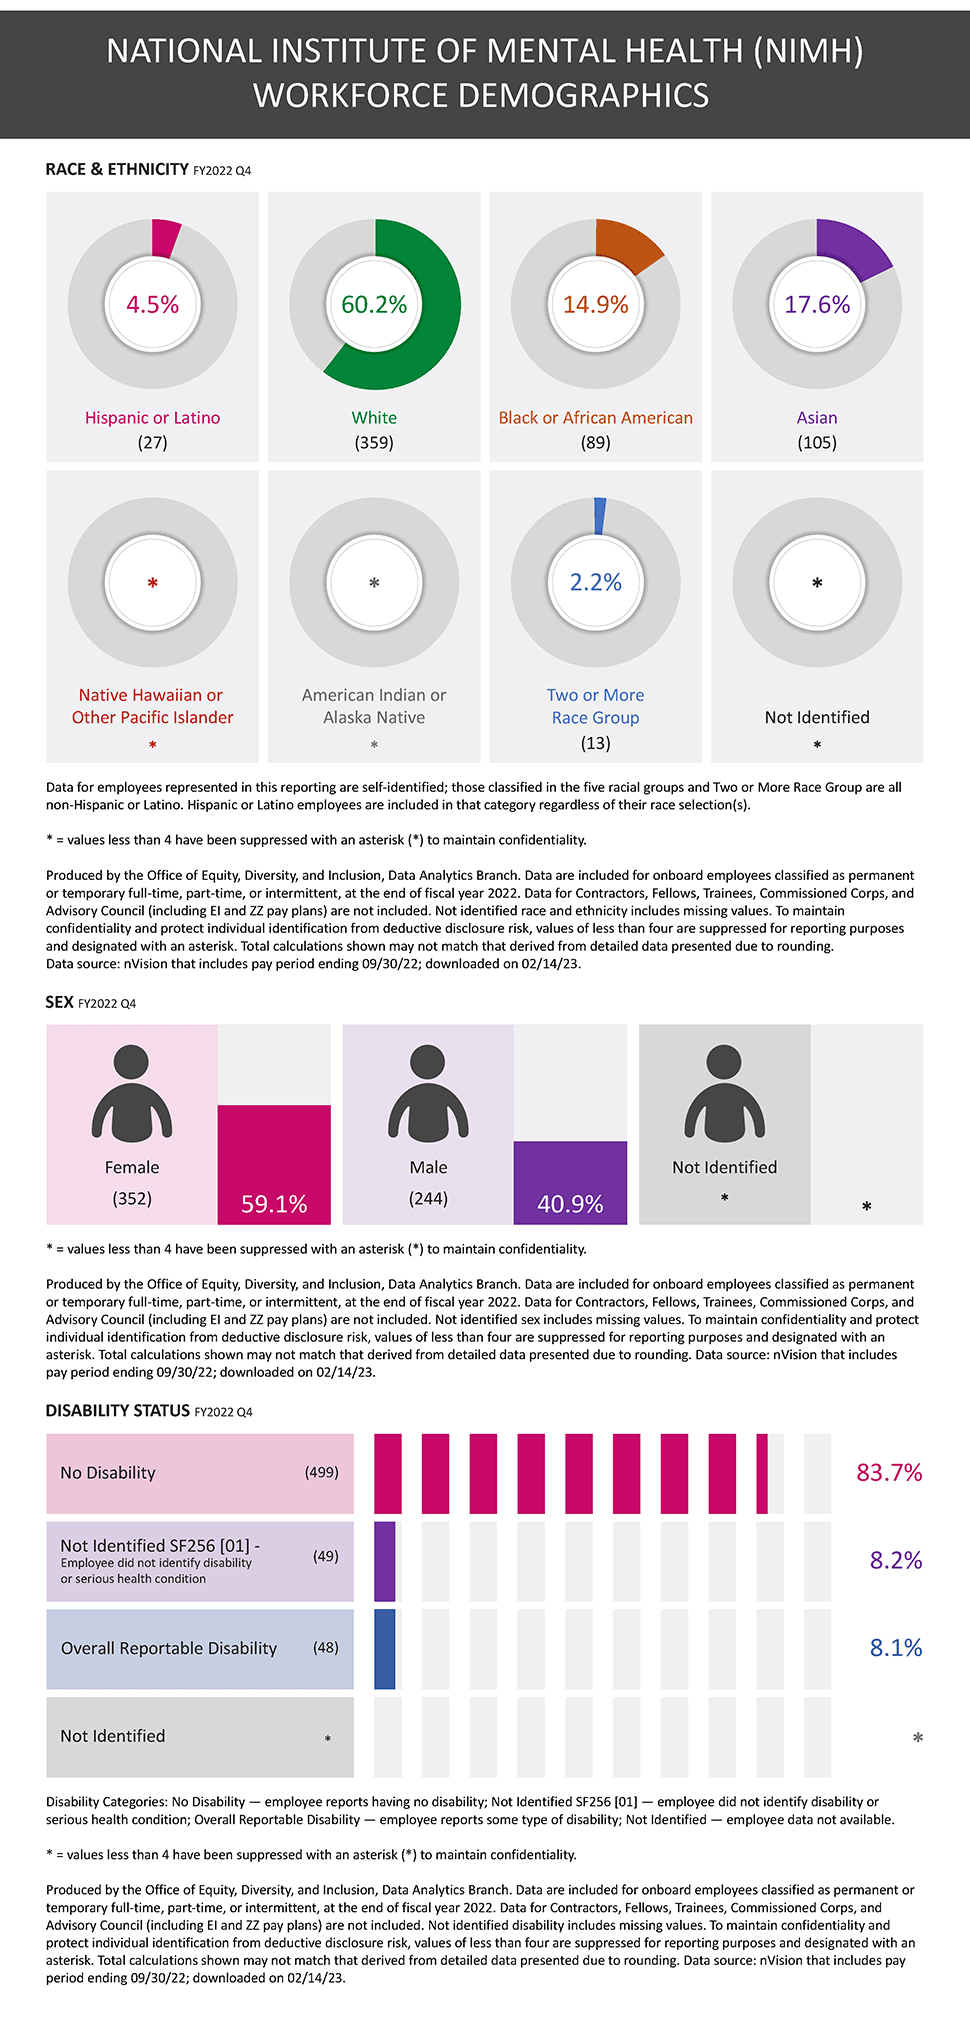
National Institute of Mental Health Workforce Demographics
RACE & ETHNICITY: Workforce Demographics by Race and Ethnicity. Graphic showing the proportions of Hispanic or Latino, White, Black or African American, Asian, Native Hawaiian or Other Pacific Islander, American Indian or Alaska Native, Two or More Race Group, and Not Identified NIH employees for Fiscal Year 2022 Fourth Quarter.
RACE & ETHNICITY: Hispanic or Latino = 27, 4.5%; White = 359, 60.2%; Black or African American = 89, 14.9%; Asian = 105, 17.6%; Native Hawaiian or Other Pacific Islander = *, *%; American Indian or Alaska Native = *, *%; Two or More Race Group = 13, 2.2%; Not Identified = *, *%
RACE & ETHNICITY: Data for employees represented in this reporting are self-identified; those classified in the five racial groups and Two or More Race Group are all non-Hispanic or Latino. Hispanic or Latino employees are included in that category regardless of their race selection(s).
SEX: Workforce Demographics by Sex. Graphic showing the proportions of Female and Male NIH employees for Fiscal Year 2022 Fourth Quarter.
SEX: FEMALE = 352, 59.1%; MALE = 244, 40.9%; Not Identified = *, *%
DISABILITY: Workforce Demographics by Disability Status. Graphic showing the proportions of NIH employees having disability status as the following: No Disability, Not Identified SF256 [01] – Employee did not identify disability or serious health condition, Overall Reportable Disability, and Not Identified NIH employees for Fiscal Year 2022 Fourth Quarter.
DISABILITY: No Disability = 499, 83.7%; Not Identified SF256 [01] – Employee did not identify disability or serious health condition = 49, 8.2%; Overall Reportable Disability = 48, 8.1%; Not Identified = *, *%
DISABILITY: Disability Categories: No Disability – employee reports having no disability; Not Identified SF256 [01] – employee did not identify disability or serious health condition; Overall Reportable Disability – employee reports some type of disability; Not Identified – employee data not available.
Produced by the Office of Equity, Diversity, and Inclusion, Data Analytics Branch. Data are included for onboard employees classified as permanent or temporary full-time, part-time, or intermittent, at the end of fiscal year 2022. Data for Contractors, Fellows, Trainees, Commissioned Corps, and Advisory Council (including EI and ZZ pay plans) are not included. Not identified race and ethnicity, sex, and disability include missing values. To maintain confidentiality and protect individual identification from deductive disclosure risk, values of less than four are suppressed for reporting purposes and designated with an asterisk. Total calculations shown may not match that derived from detailed data presented due to rounding. Data source: nVision that includes pay period ending 09/30/22; downloaded on 02/14/23.
Click graphic below to open full-size graphic in a new window.
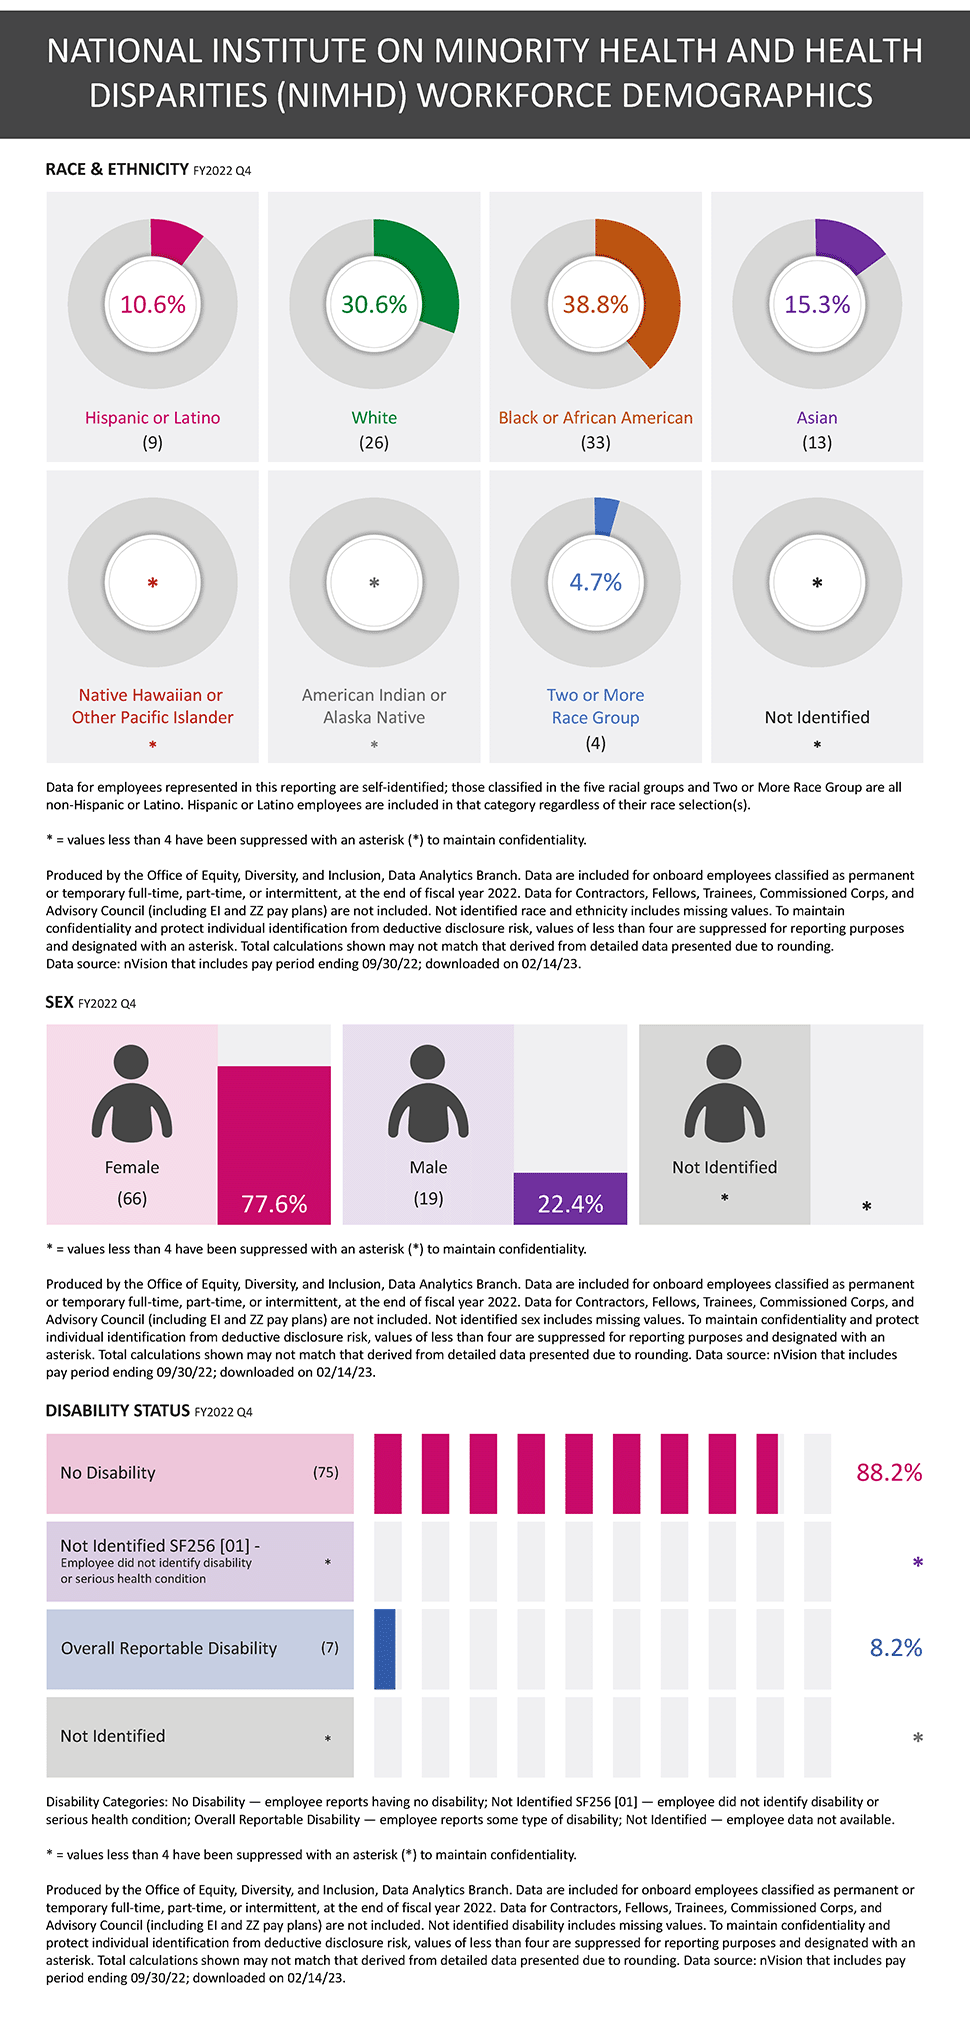
National Institute on Minority Health and Health Disparities Workforce Demographics
RACE & ETHNICITY: Workforce Demographics by Race and Ethnicity. Graphic showing the proportions of Hispanic or Latino, White, Black or African American, Asian, Native Hawaiian or Other Pacific Islander, American Indian or Alaska Native, Two or More Race Group, and Not Identified NIH employees for Fiscal Year 2022 Fourth Quarter.
RACE & ETHNICITY: Hispanic or Latino = 9, 10.6%; White = 26, 30.6%; Black or African American = 33, 38.8%; Asian = 13, 15.3%; Native Hawaiian or Other Pacific Islander = *, *%; American Indian or Alaska Native = *, *%; Two or More Race Group = 4, 4.7%; Not Identified = *, *%
RACE & ETHNICITY: Data for employees represented in this reporting are self-identified; those classified in the five racial groups and Two or More Race Group are all non-Hispanic or Latino. Hispanic or Latino employees are included in that category regardless of their race selection(s).
SEX: Workforce Demographics by Sex. Graphic showing the proportions of Female and Male NIH employees for Fiscal Year 2022 Fourth Quarter.
SEX: FEMALE = 66, 77.6%; MALE = 19, 22.4%; Not Identified = *, *%
DISABILITY: Workforce Demographics by Disability Status. Graphic showing the proportions of NIH employees having disability status as the following: No Disability, Not Identified SF256 [01] – Employee did not identify disability or serious health condition, Overall Reportable Disability, and Not Identified NIH employees for Fiscal Year 2022 Fourth Quarter.
DISABILITY: No Disability = 75, 88.2%; Not Identified SF256 [01] – Employee did not identify disability or serious health condition = *, 3.5%; Overall Reportable Disability = 7, 8.2%; Not Identified = *, *%
DISABILITY: Disability Categories: No Disability – employee reports having no disability; Not Identified SF256 [01] – employee did not identify disability or serious health condition; Overall Reportable Disability – employee reports some type of disability; Not Identified – employee data not available.
Produced by the Office of Equity, Diversity, and Inclusion, Data Analytics Branch. Data are included for onboard employees classified as permanent or temporary full-time, part-time, or intermittent, at the end of fiscal year 2022. Data for Contractors, Fellows, Trainees, Commissioned Corps, and Advisory Council (including EI and ZZ pay plans) are not included. Not identified race and ethnicity, sex, and disability include missing values. To maintain confidentiality and protect individual identification from deductive disclosure risk, values of less than four are suppressed for reporting purposes and designated with an asterisk. Total calculations shown may not match that derived from detailed data presented due to rounding. Data source: nVision that includes pay period ending 09/30/22; downloaded on 02/14/23.
Click graphic below to open full-size graphic in a new window.
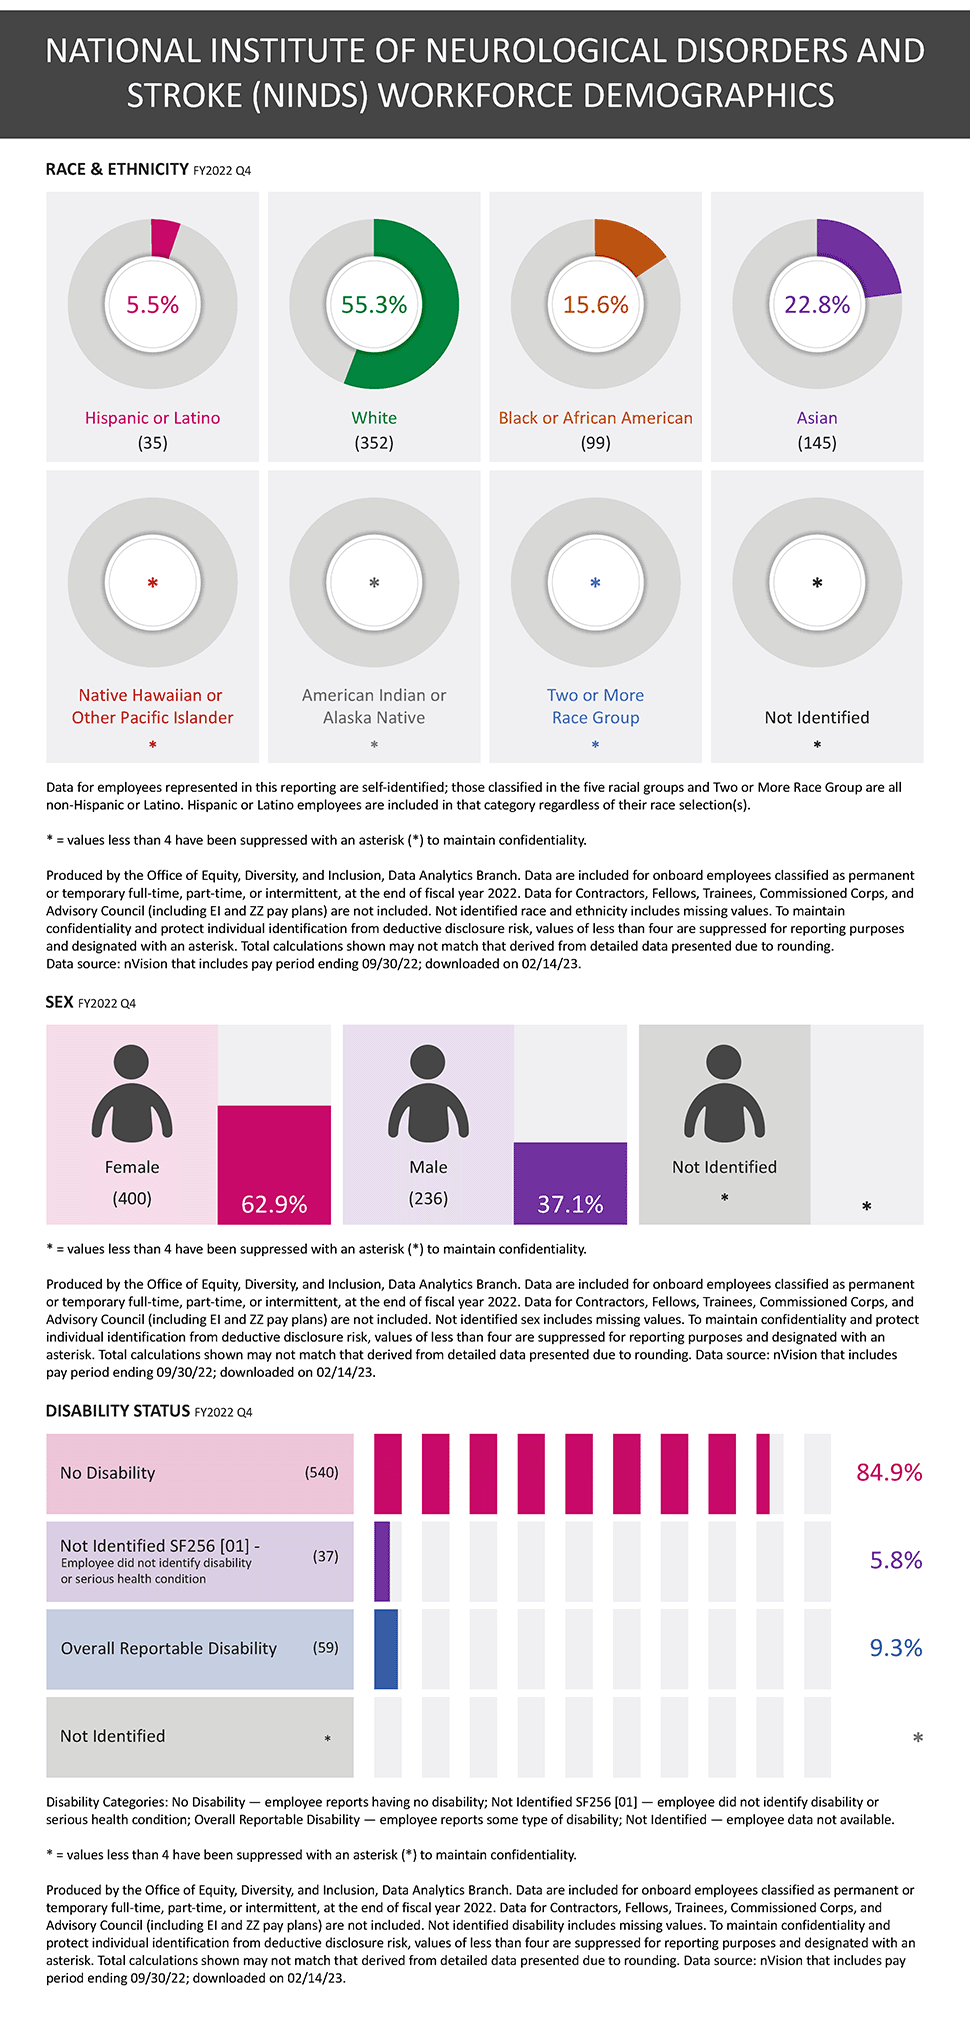
National Institute of Neurological Disorders and Stroke Workforce Demographics
RACE & ETHNICITY: Workforce Demographics by Race and Ethnicity. Graphic showing the proportions of Hispanic or Latino, White, Black or African American, Asian, Native Hawaiian or Other Pacific Islander, American Indian or Alaska Native, Two or More Race Group, and Not Identified NIH employees for Fiscal Year 2022 Fourth Quarter.
RACE & ETHNICITY: Hispanic or Latino = 35, 5.5%; White = 352, 55.3%; Black or African American = 99, 15.6%; Asian = 145, 22.8%; Native Hawaiian or Other Pacific Islander = *, *%; American Indian or Alaska Native = *, *%; Two or More Race Group = *, *%; Not Identified = *, *%
RACE & ETHNICITY: Data for employees represented in this reporting are self-identified; those classified in the five racial groups and Two or More Race Group are all non-Hispanic or Latino. Hispanic or Latino employees are included in that category regardless of their race selection(s).
SEX: Workforce Demographics by Sex. Graphic showing the proportions of Female and Male NIH employees for Fiscal Year 2022 Fourth Quarter.
SEX: FEMALE = 400, 62.9%; MALE = 236, 37.1%; Not Identified = *, *%
DISABILITY: Workforce Demographics by Disability Status. Graphic showing the proportions of NIH employees having disability status as the following: No Disability, Not Identified SF256 [01] – Employee did not identify disability or serious health condition, Overall Reportable Disability, and Not Identified NIH employees for Fiscal Year 2022 Fourth Quarter.
DISABILITY: No Disability = 540, 84.9%; Not Identified SF256 [01] – Employee did not identify disability or serious health condition = 37, 5.8%; Overall Reportable Disability = 59, 9.3%; Not Identified = *, *%
DISABILITY: Disability Categories: No Disability – employee reports having no disability; Not Identified SF256 [01] – employee did not identify disability or serious health condition; Overall Reportable Disability – employee reports some type of disability; Not Identified – employee data not available.
Produced by the Office of Equity, Diversity, and Inclusion, Data Analytics Branch. Data are included for onboard employees classified as permanent or temporary full-time, part-time, or intermittent, at the end of fiscal year 2022. Data for Contractors, Fellows, Trainees, Commissioned Corps, and Advisory Council (including EI and ZZ pay plans) are not included. Not identified race and ethnicity, sex, and disability include missing values. To maintain confidentiality and protect individual identification from deductive disclosure risk, values of less than four are suppressed for reporting purposes and designated with an asterisk. Total calculations shown may not match that derived from detailed data presented due to rounding. Data source: nVision that includes pay period ending 09/30/22; downloaded on 02/14/23.
Click graphic below to open full-size graphic in a new window.
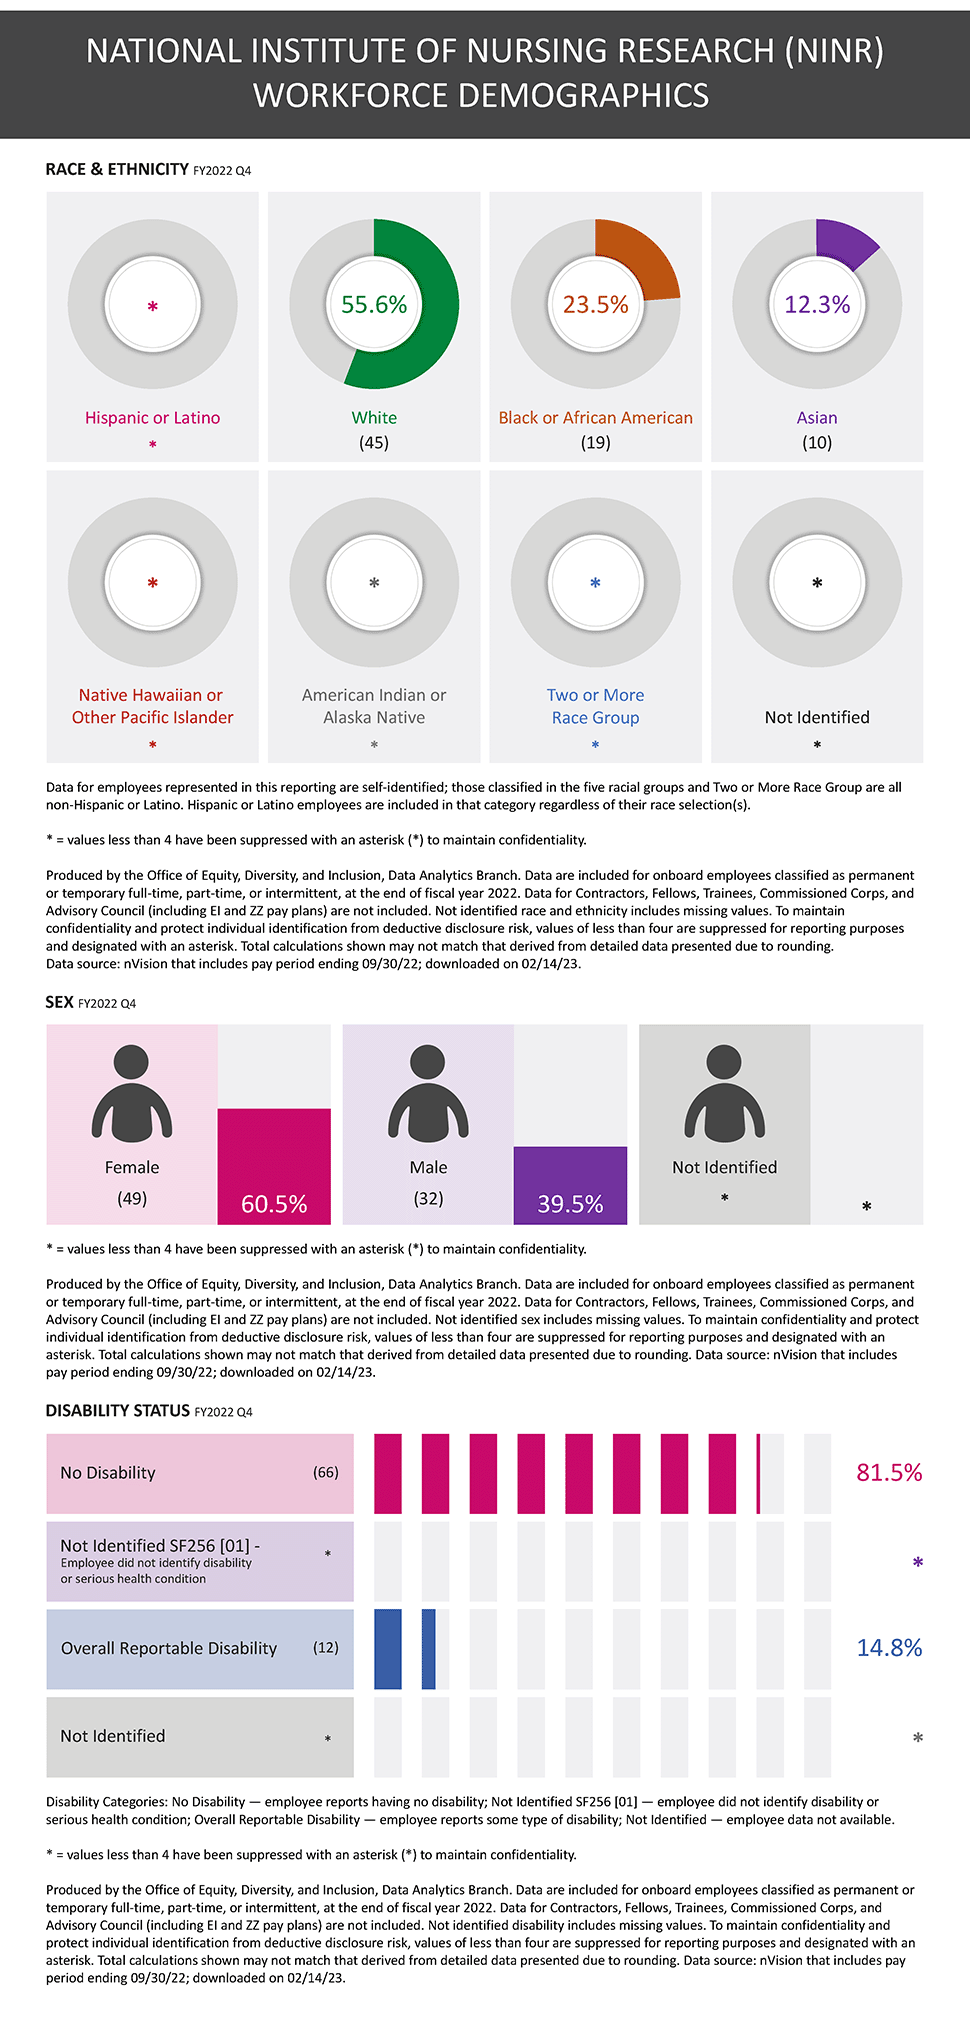
National Institute of Nursing Research Workforce Demographics
RACE & ETHNICITY: Workforce Demographics by Race and Ethnicity. Graphic showing the proportions of Hispanic or Latino, White, Black or African American, Asian, Native Hawaiian or Other Pacific Islander, American Indian or Alaska Native, Two or More Race Group, and Not Identified NIH employees for Fiscal Year 2022 Fourth Quarter.
RACE & ETHNICITY: Hispanic or Latino = *, *%; White = 45, 55.6%; Black or African American = 19, 23.5%; Asian = 10, 12.3%; Native Hawaiian or Other Pacific Islander = *, *%; American Indian or Alaska Native = *, *%; Two or More Race Group = *, *%; Not Identified = *, *%
RACE & ETHNICITY: Data for employees represented in this reporting are self-identified; those classified in the five racial groups and Two or More Race Group are all non-Hispanic or Latino. Hispanic or Latino employees are included in that category regardless of their race selection(s).
SEX: Workforce Demographics by Sex. Graphic showing the proportions of Female and Male NIH employees for Fiscal Year 2022 Fourth Quarter.
SEX: FEMALE = 49, 60.5%; MALE = 32, 39.5%; Not Identified = *, *%
DISABILITY: Workforce Demographics by Disability Status. Graphic showing the proportions of NIH employees having disability status as the following: No Disability, Not Identified SF256 [01] – Employee did not identify disability or serious health condition, Overall Reportable Disability, and Not Identified NIH employees for Fiscal Year 2022 Fourth Quarter.
DISABILITY: No Disability = 66, 81.5%; Not Identified SF256 [01] – Employee did not identify disability or serious health condition = *, 3.7%; Overall Reportable Disability = 12, 14.8%; Not Identified = *, *%
DISABILITY: Disability Categories: No Disability – employee reports having no disability; Not Identified SF256 [01] – employee did not identify disability or serious health condition; Overall Reportable Disability – employee reports some type of disability; Not Identified – employee data not available.
Produced by the Office of Equity, Diversity, and Inclusion, Data Analytics Branch. Data are included for onboard employees classified as permanent or temporary full-time, part-time, or intermittent, at the end of fiscal year 2022. Data for Contractors, Fellows, Trainees, Commissioned Corps, and Advisory Council (including EI and ZZ pay plans) are not included. Not identified race and ethnicity, sex, and disability include missing values. To maintain confidentiality and protect individual identification from deductive disclosure risk, values of less than four are suppressed for reporting purposes and designated with an asterisk. Total calculations shown may not match that derived from detailed data presented due to rounding. Data source: nVision that includes pay period ending 09/30/22; downloaded on 02/14/23.
Click graphic below to open full-size graphic in a new window.
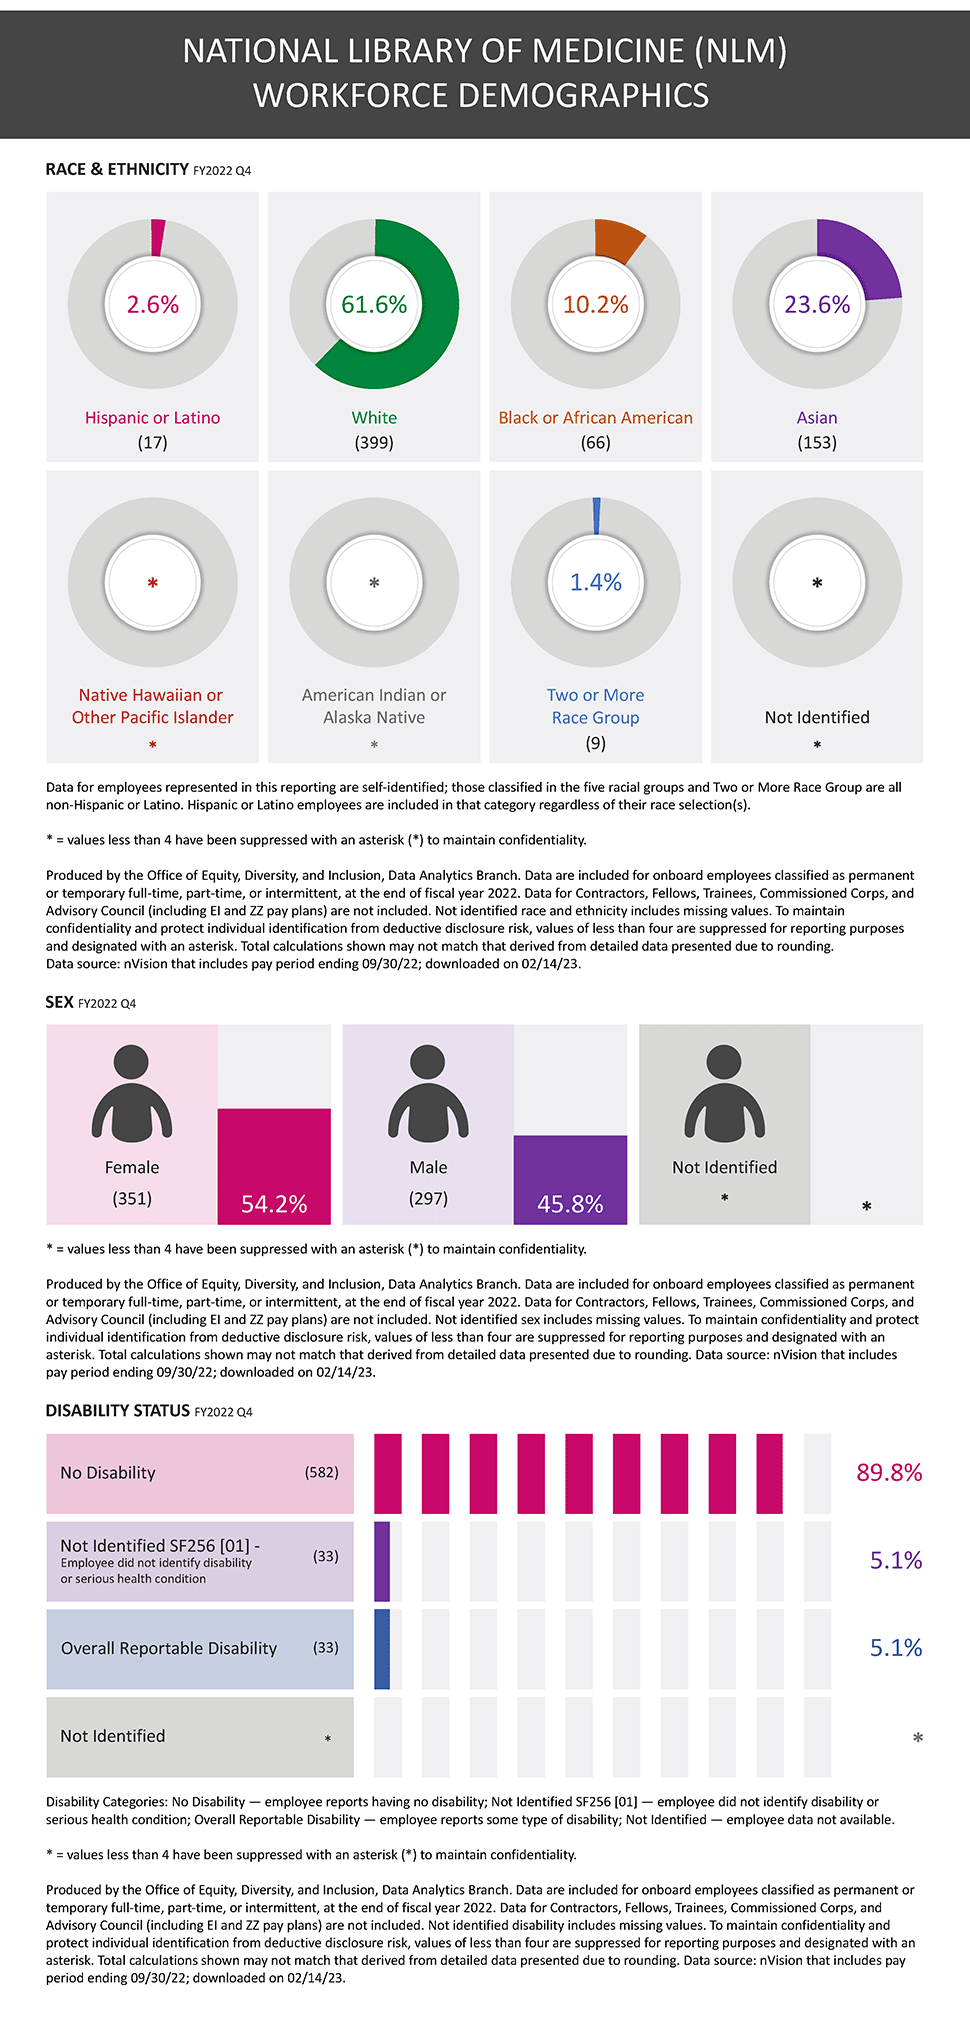
National Libraray of Medicine Workforce Demographics
RACE & ETHNICITY: Workforce Demographics by Race and Ethnicity. Graphic showing the proportions of Hispanic or Latino, White, Black or African American, Asian, Native Hawaiian or Other Pacific Islander, American Indian or Alaska Native, Two or More Race Group, and Not Identified NIH employees for Fiscal Year 2022 Fourth Quarter.
RACE & ETHNICITY: Hispanic or Latino = 17, 2.6%; White = 399, 61.6%; Black or African American = 66, 10.2%; Asian = 153, 23.6%; Native Hawaiian or Other Pacific Islander = *, *%; American Indian or Alaska Native = *, *%; Two or More Race Group = 9, 1.4%; Not Identified = *, *%
RACE & ETHNICITY: Data for employees represented in this reporting are self-identified; those classified in the five racial groups and Two or More Race Group are all non-Hispanic or Latino. Hispanic or Latino employees are included in that category regardless of their race selection(s).
SEX: Workforce Demographics by Sex. Graphic showing the proportions of Female and Male NIH employees for Fiscal Year 2022 Fourth Quarter.
SEX: FEMALE = 351, 54.2%; MALE = 297, 45.8%; Not Identified = *, *%
DISABILITY: Workforce Demographics by Disability Status. Graphic showing the proportions of NIH employees having disability status as the following: No Disability, Not Identified SF256 [01] – Employee did not identify disability or serious health condition, Overall Reportable Disability, and Not Identified NIH employees for Fiscal Year 2022 Fourth Quarter.
DISABILITY: No Disability = 582, 89.8%; Not Identified SF256 [01] – Employee did not identify disability or serious health condition = 33, 5.1%; Overall Reportable Disability = 33, 5.1%; Not Identified = *, *%
DISABILITY: Disability Categories: No Disability – employee reports having no disability; Not Identified SF256 [01] – employee did not identify disability or serious health condition; Overall Reportable Disability – employee reports some type of disability; Not Identified – employee data not available.
Produced by the Office of Equity, Diversity, and Inclusion, Data Analytics Branch. Data are included for onboard employees classified as permanent or temporary full-time, part-time, or intermittent, at the end of fiscal year 2022. Data for Contractors, Fellows, Trainees, Commissioned Corps, and Advisory Council (including EI and ZZ pay plans) are not included. Not identified race and ethnicity, sex, and disability include missing values. To maintain confidentiality and protect individual identification from deductive disclosure risk, values of less than four are suppressed for reporting purposes and designated with an asterisk. Total calculations shown may not match that derived from detailed data presented due to rounding. Data source: nVision that includes pay period ending 09/30/22; downloaded on 02/14/23.
Click graphic below to open full-size graphic in a new window.
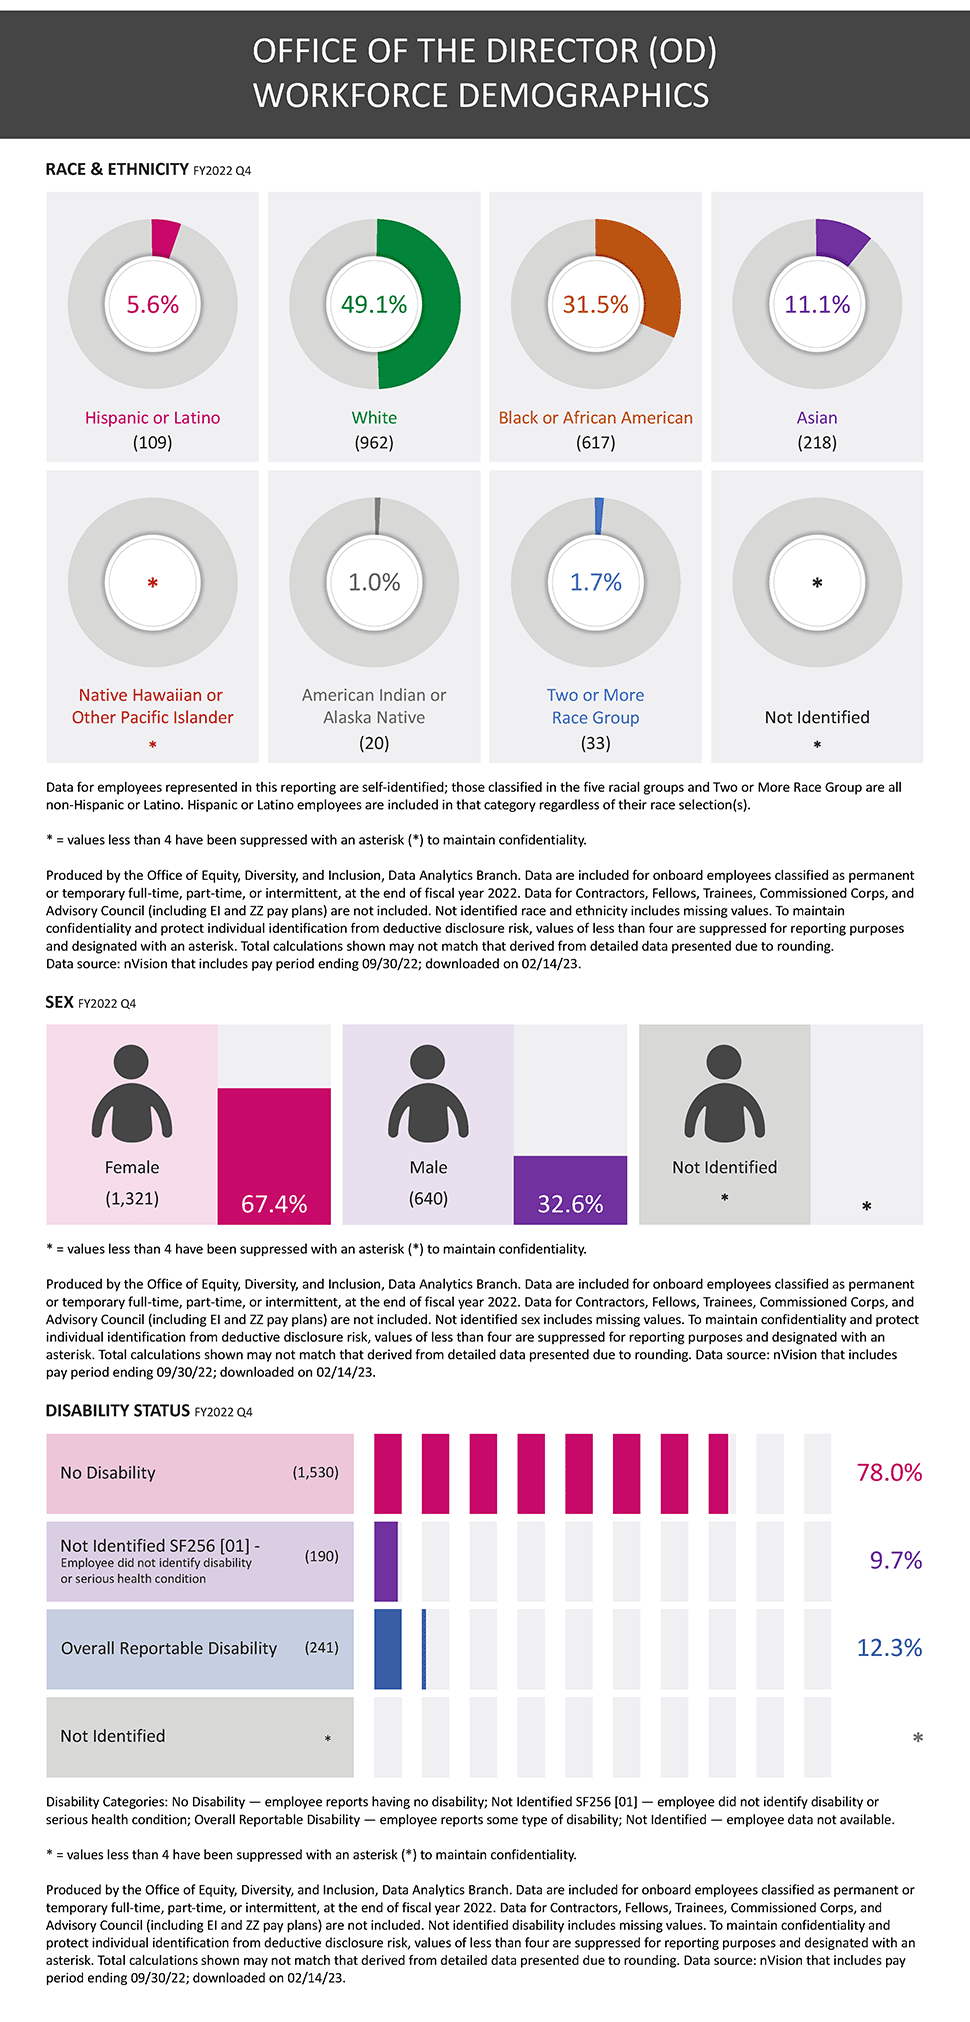
National Institutes of Health Office of the Director Workforce Demographics
RACE & ETHNICITY: Workforce Demographics by Race and Ethnicity. Graphic showing the proportions of Hispanic or Latino, White, Black or African American, Asian, Native Hawaiian or Other Pacific Islander, American Indian or Alaska Native, Two or More Race Group, and Not Identified NIH employees for Fiscal Year 2022 Fourth Quarter.
RACE & ETHNICITY: Hispanic or Latino = 109, 5.6%; White = 962, 49.1%; Black or African American = 617, 31.5%; Asian = 218, 11.1%; Native Hawaiian or Other Pacific Islander = *, *%; American Indian or Alaska Native = 20, 1.0%; Two or More Race Group = 33, 1.7%; Not Identified = *, *%
RACE & ETHNICITY: Data for employees represented in this reporting are self-identified; those classified in the five racial groups and Two or More Race Group are all non-Hispanic or Latino. Hispanic or Latino employees are included in that category regardless of their race selection(s).
SEX: Workforce Demographics by Sex. Graphic showing the proportions of Female and Male NIH employees for Fiscal Year 2022 Fourth Quarter.
SEX: FEMALE = 1321, 67.4%; MALE = 640, 32.6%; Not Identified = *, *%
DISABILITY: Workforce Demographics by Disability Status. Graphic showing the proportions of NIH employees having disability status as the following: No Disability, Not Identified SF256 [01] – Employee did not identify disability or serious health condition, Overall Reportable Disability, and Not Identified NIH employees for Fiscal Year 2022 Fourth Quarter.
DISABILITY: No Disability = 1530, 78.0%; Not Identified SF256 [01] – Employee did not identify disability or serious health condition = 190, 9.7%; Overall Reportable Disability = 241, 12.3%; Not Identified = *, *%
DISABILITY: Disability Categories: No Disability – employee reports having no disability; Not Identified SF256 [01] – employee did not identify disability or serious health condition; Overall Reportable Disability – employee reports some type of disability; Not Identified – employee data not available.
Produced by the Office of Equity, Diversity, and Inclusion, Data Analytics Branch. Data are included for onboard employees classified as permanent or temporary full-time, part-time, or intermittent, at the end of fiscal year 2022. Data for Contractors, Fellows, Trainees, Commissioned Corps, and Advisory Council (including EI and ZZ pay plans) are not included. Not identified race and ethnicity, sex, and disability include missing values. To maintain confidentiality and protect individual identification from deductive disclosure risk, values of less than four are suppressed for reporting purposes and designated with an asterisk. Total calculations shown may not match that derived from detailed data presented due to rounding. Data source: nVision that includes pay period ending 09/30/22; downloaded on 02/14/23.
Click graphic below to open full-size graphic in a new window.
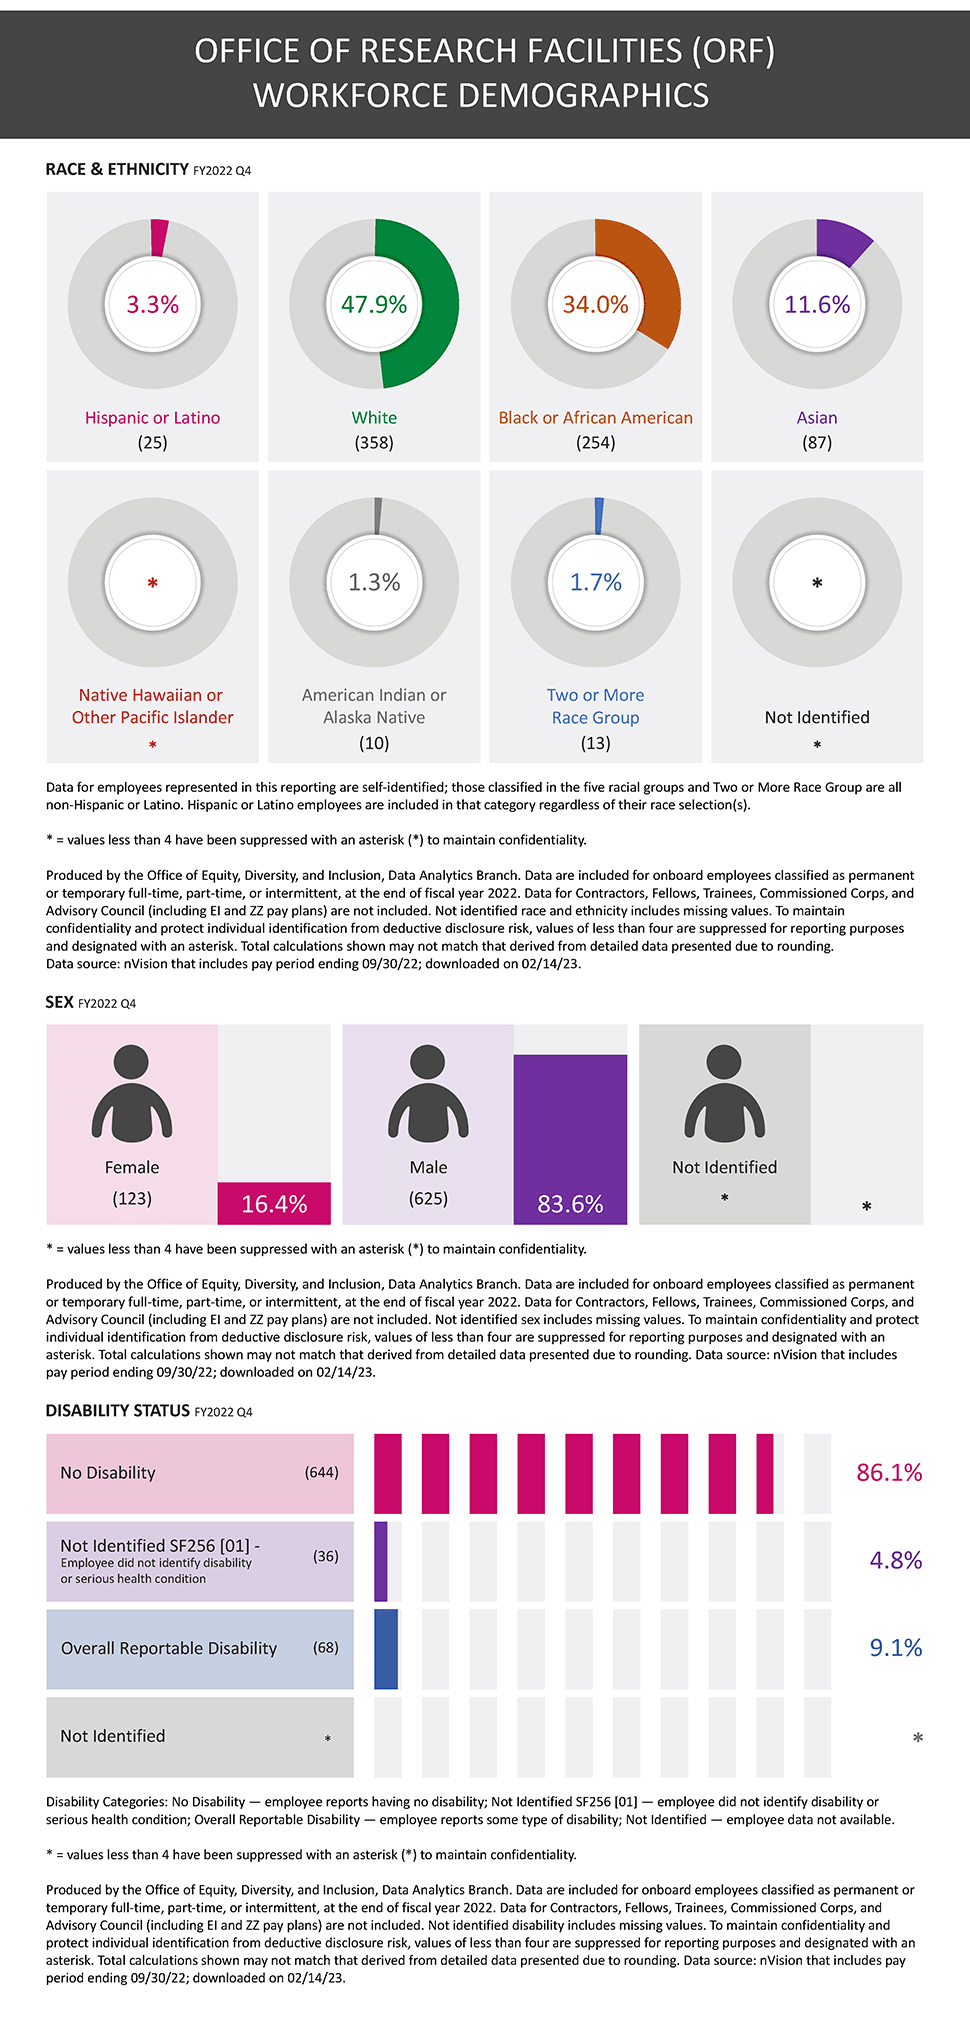
National Institutes of Health Office of Research Facilities Workforce Demographics
RACE & ETHNICITY: Workforce Demographics by Race and Ethnicity. Graphic showing the proportions of Hispanic or Latino, White, Black or African American, Asian, Native Hawaiian or Other Pacific Islander, American Indian or Alaska Native, Two or More Race Group, and Not Identified NIH employees for Fiscal Year 2022 Fourth Quarter.
RACE & ETHNICITY: Hispanic or Latino = 25, 3.3%; White = 358, 47.9%; Black or African American = 254, 34.0%; Asian = 87, 11.6%; Native Hawaiian or Other Pacific Islander = *, *%; American Indian or Alaska Native = 10, 1.3%; Two or More Race Group = 13, 1.7%; Not Identified = *, *%
RACE & ETHNICITY: Data for employees represented in this reporting are self-identified; those classified in the five racial groups and Two or More Race Group are all non-Hispanic or Latino. Hispanic or Latino employees are included in that category regardless of their race selection(s).
SEX: Workforce Demographics by Sex. Graphic showing the proportions of Female and Male NIH employees for Fiscal Year 2022 Fourth Quarter.
SEX: FEMALE = 123, 16.4%; MALE = 625, 83.6%; Not Identified = *, *%
DISABILITY: Workforce Demographics by Disability Status. Graphic showing the proportions of NIH employees having disability status as the following: No Disability, Not Identified SF256 [01] – Employee did not identify disability or serious health condition, Overall Reportable Disability, and Not Identified NIH employees for Fiscal Year 2022 Fourth Quarter.
DISABILITY: No Disability = 644, 86.1%; Not Identified SF256 [01] – Employee did not identify disability or serious health condition = 36, 4.8%; Overall Reportable Disability = 68, 9.1%; Not Identified = *, *%
DISABILITY: Disability Categories: No Disability – employee reports having no disability; Not Identified SF256 [01] – employee did not identify disability or serious health condition; Overall Reportable Disability – employee reports some type of disability; Not Identified – employee data not available.
Produced by the Office of Equity, Diversity, and Inclusion, Data Analytics Branch. Data are included for onboard employees classified as permanent or temporary full-time, part-time, or intermittent, at the end of fiscal year 2022. Data for Contractors, Fellows, Trainees, Commissioned Corps, and Advisory Council (including EI and ZZ pay plans) are not included. Not identified race and ethnicity, sex, and disability include missing values. To maintain confidentiality and protect individual identification from deductive disclosure risk, values of less than four are suppressed for reporting purposes and designated with an asterisk. Total calculations shown may not match that derived from detailed data presented due to rounding. Data source: nVision that includes pay period ending 09/30/22; downloaded on 02/14/23.
Click graphic below to open full-size graphic in a new window.
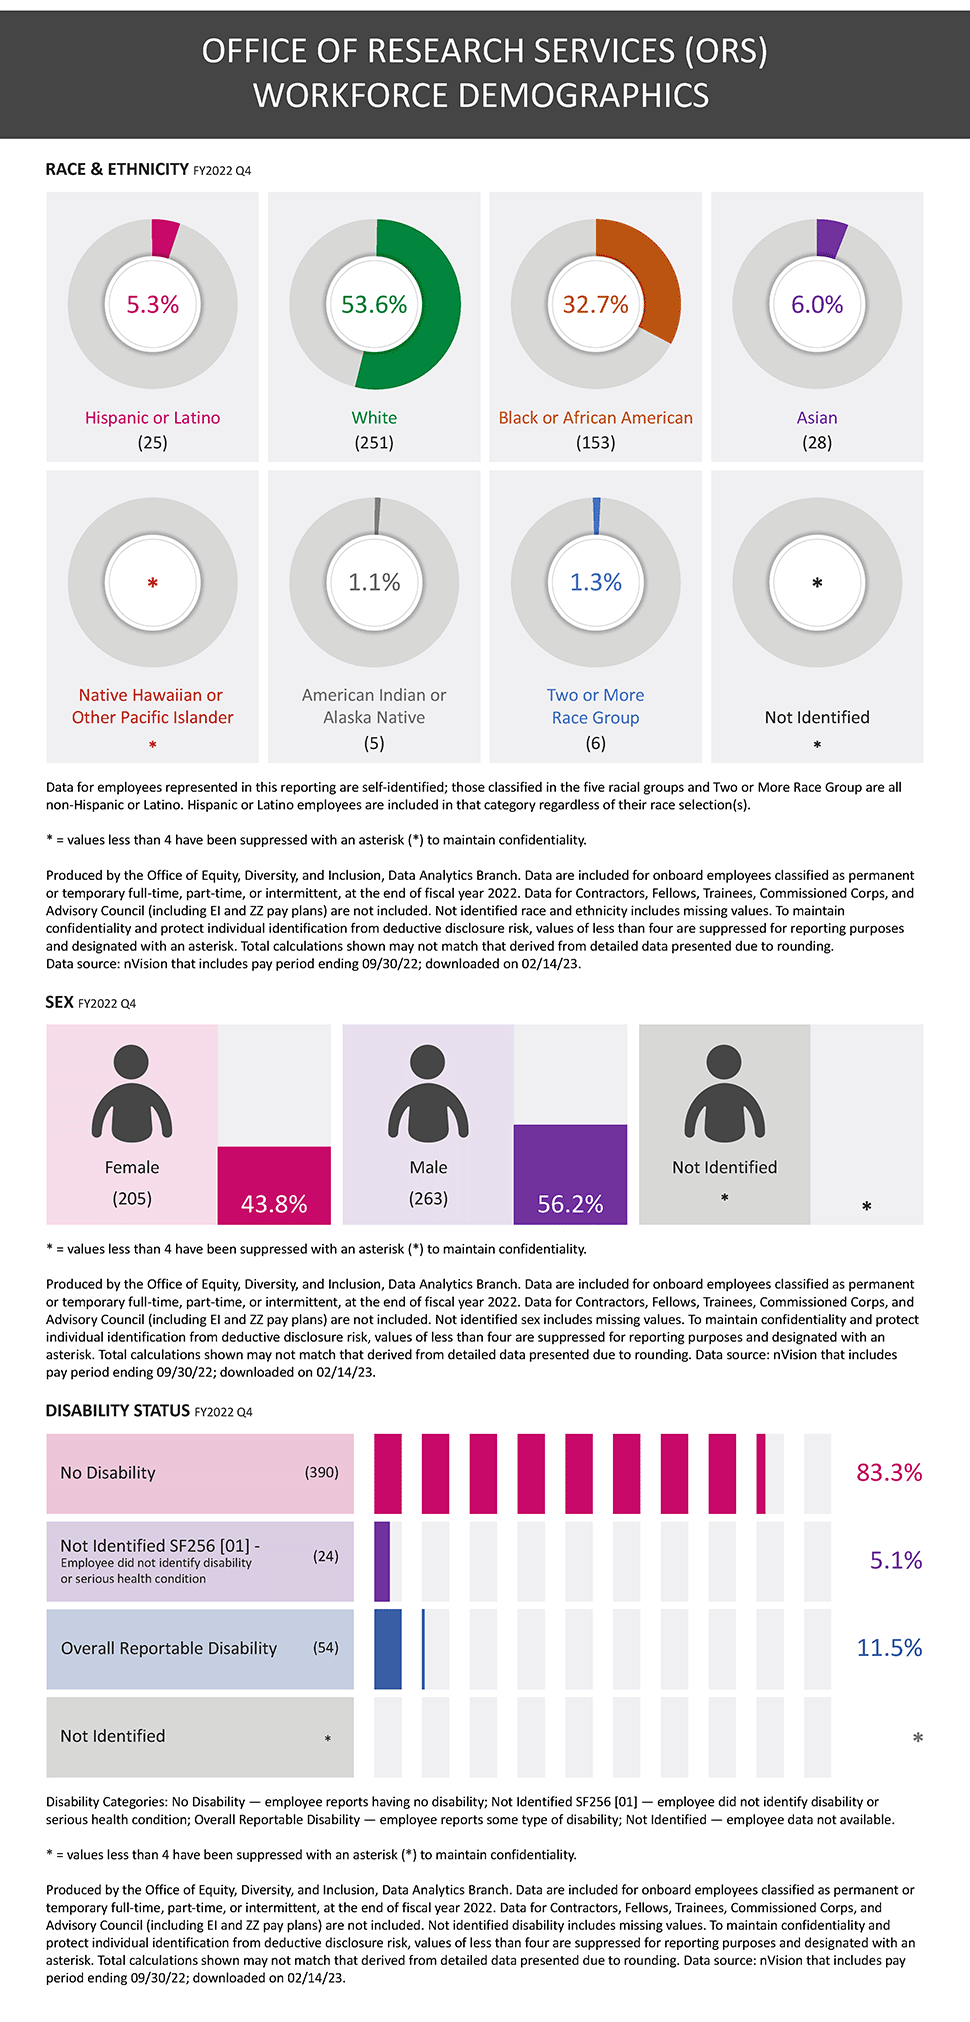
National Institutes of Health Office of Research Services Workforce Demographics
RACE & ETHNICITY: Workforce Demographics by Race and Ethnicity. Graphic showing the proportions of Hispanic or Latino, White, Black or African American, Asian, Native Hawaiian or Other Pacific Islander, American Indian or Alaska Native, Two or More Race Group, and Not Identified NIH employees for Fiscal Year 2022 Fourth Quarter.
RACE & ETHNICITY: Hispanic or Latino = 25, 5.3%; White = 251, 53.6%; Black or African American = 153, 32.7%; Asian = 28, 6.0%; Native Hawaiian or Other Pacific Islander = *, *%; American Indian or Alaska Native = 5, 1.1%; Two or More Race Group = 6, 1.3%; Not Identified = *, *%
RACE & ETHNICITY: Data for employees represented in this reporting are self-identified; those classified in the five racial groups and Two or More Race Group are all non-Hispanic or Latino. Hispanic or Latino employees are included in that category regardless of their race selection(s).
SEX: Workforce Demographics by Sex. Graphic showing the proportions of Female and Male NIH employees for Fiscal Year 2022 Fourth Quarter.
SEX: FEMALE = 205, 43.8%; MALE = 263, 56.2%; Not Identified = *, *%
DISABILITY: Workforce Demographics by Disability Status. Graphic showing the proportions of NIH employees having disability status as the following: No Disability, Not Identified SF256 [01] – Employee did not identify disability or serious health condition, Overall Reportable Disability, and Not Identified NIH employees for Fiscal Year 2022 Fourth Quarter.
DISABILITY: No Disability = 390, 83.3%; Not Identified SF256 [01] – Employee did not identify disability or serious health condition = 24, 5.1%; Overall Reportable Disability = 54, 11.5%; Not Identified = *, *%
DISABILITY: Disability Categories: No Disability – employee reports having no disability; Not Identified SF256 [01] – employee did not identify disability or serious health condition; Overall Reportable Disability – employee reports some type of disability; Not Identified – employee data not available.
Produced by the Office of Equity, Diversity, and Inclusion, Data Analytics Branch. Data are included for onboard employees classified as permanent or temporary full-time, part-time, or intermittent, at the end of fiscal year 2022. Data for Contractors, Fellows, Trainees, Commissioned Corps, and Advisory Council (including EI and ZZ pay plans) are not included. Not identified race and ethnicity, sex, and disability include missing values. To maintain confidentiality and protect individual identification from deductive disclosure risk, values of less than four are suppressed for reporting purposes and designated with an asterisk. Total calculations shown may not match that derived from detailed data presented due to rounding. Data source: nVision that includes pay period ending 09/30/22; downloaded on 02/14/23.
Click graphic below to open full-size graphic in a new window.
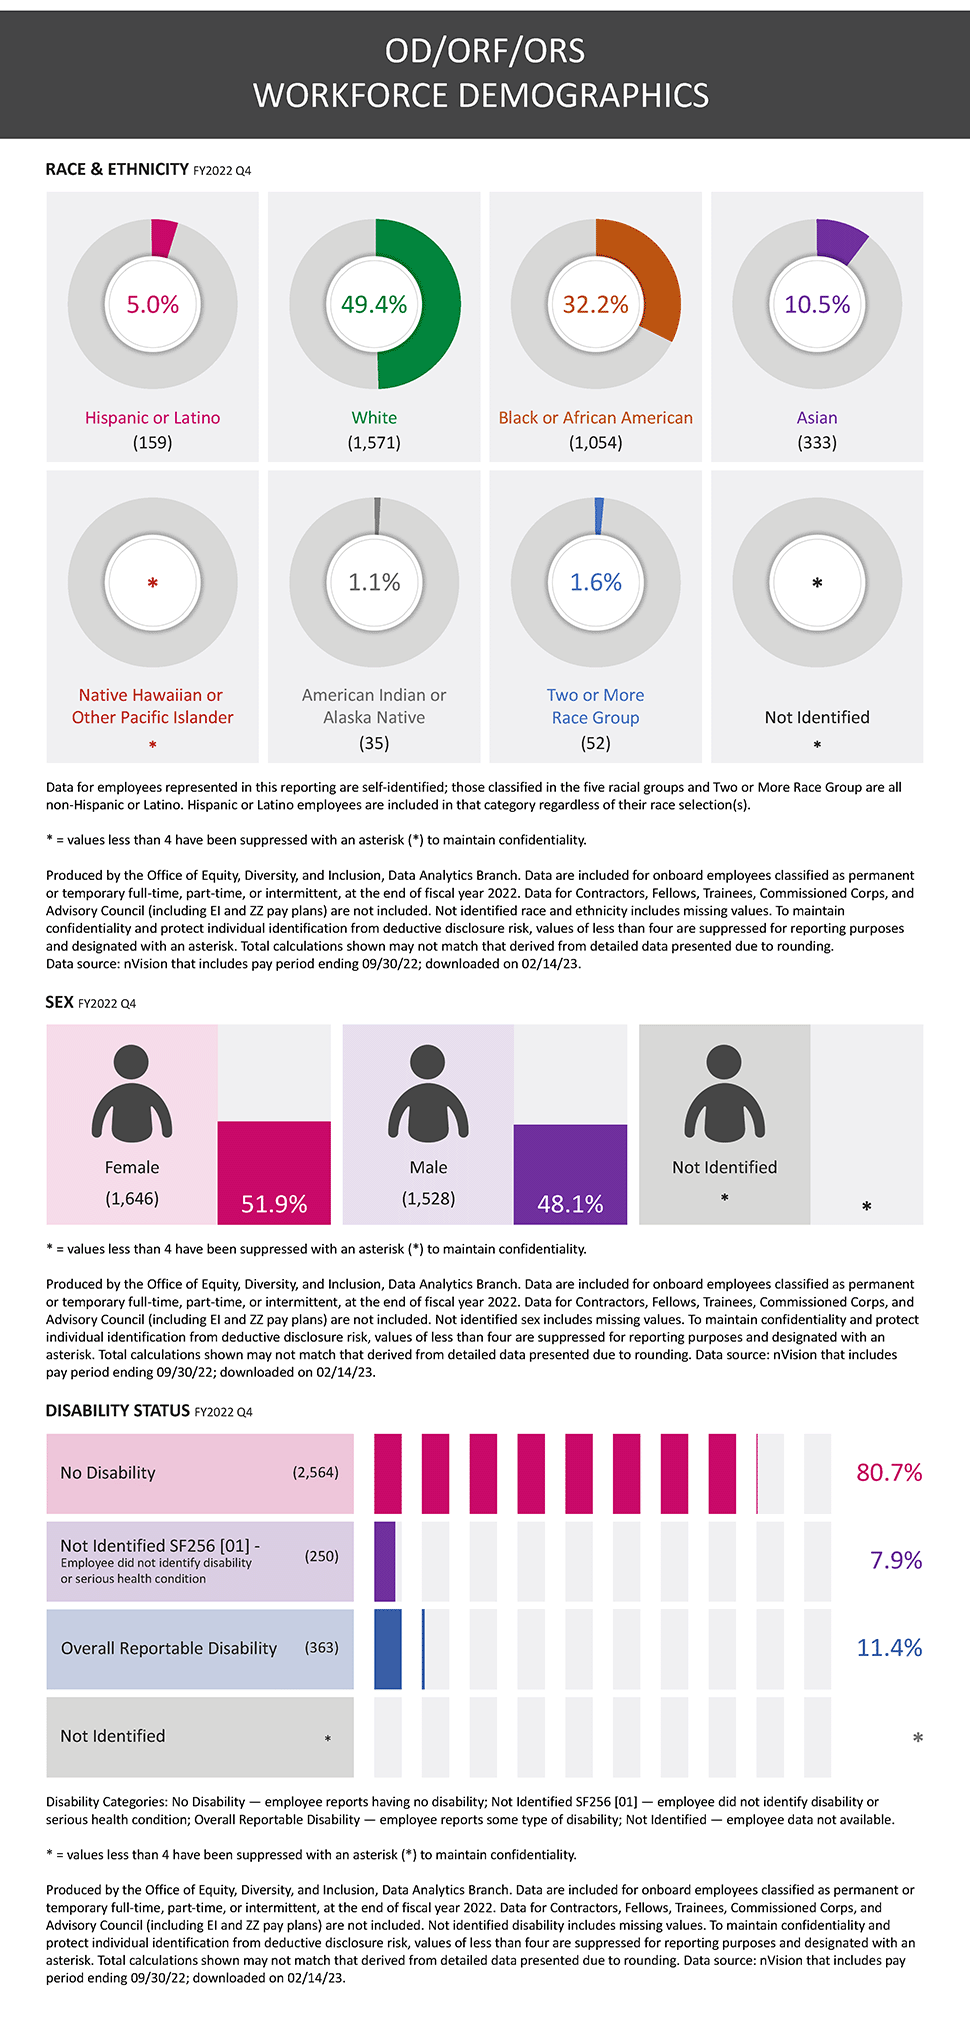
OD/ORF/ORS Workforce Demographics
RACE & ETHNICITY: Workforce Demographics by Race and Ethnicity. Graphic showing the proportions of Hispanic or Latino, White, Black or African American, Asian, Native Hawaiian or Other Pacific Islander, American Indian or Alaska Native, Two or More Race Group, and Not Identified NIH employees for Fiscal Year 2022 Fourth Quarter.
RACE & ETHNICITY: Hispanic or Latino = 159, 5.0%; White = 1571, 49.4%; Black or African American = 1024, 32.2%; Asian = 333, 10.5%; Native Hawaiian or Other Pacific Islander = *, *%; American Indian or Alaska Native = 35, 1.1%; Two or More Race Group = 52, 1.6%; Not Identified = *, *%
RACE & ETHNICITY: Data for employees represented in this reporting are self-identified; those classified in the five racial groups and Two or More Race Group are all non-Hispanic or Latino. Hispanic or Latino employees are included in that category regardless of their race selection(s).
SEX: Workforce Demographics by Sex. Graphic showing the proportions of Female and Male NIH employees for Fiscal Year 2022 Fourth Quarter.
SEX: FEMALE = 1649, 51.9%; MALE = 1528, 48.1%; Not Identified = *, *%
DISABILITY: Workforce Demographics by Disability Status. Graphic showing the proportions of NIH employees having disability status as the following: No Disability, Not Identified SF256 [01] – Employee did not identify disability or serious health condition, Overall Reportable Disability, and Not Identified NIH employees for Fiscal Year 2022 Fourth Quarter.
DISABILITY: No Disability = 2564, 80.7%; Not Identified SF256 [01] – Employee did not identify disability or serious health condition = 250, 7.9%; Overall Reportable Disability = 363, 11.4%; Not Identified = *, *%
DISABILITY: Disability Categories: No Disability – employee reports having no disability; Not Identified SF256 [01] – employee did not identify disability or serious health condition; Overall Reportable Disability – employee reports some type of disability; Not Identified – employee data not available.
Produced by the Office of Equity, Diversity, and Inclusion, Data Analytics Branch. Data are included for onboard employees classified as permanent or temporary full-time, part-time, or intermittent, at the end of fiscal year 2022. Data for Contractors, Fellows, Trainees, Commissioned Corps, and Advisory Council (including EI and ZZ pay plans) are not included. Not identified race and ethnicity, sex, and disability include missing values. To maintain confidentiality and protect individual identification from deductive disclosure risk, values of less than four are suppressed for reporting purposes and designated with an asterisk. Total calculations shown may not match that derived from detailed data presented due to rounding. Data source: nVision that includes pay period ending 09/30/22; downloaded on 02/14/23.

